Free Access
Fig. 7
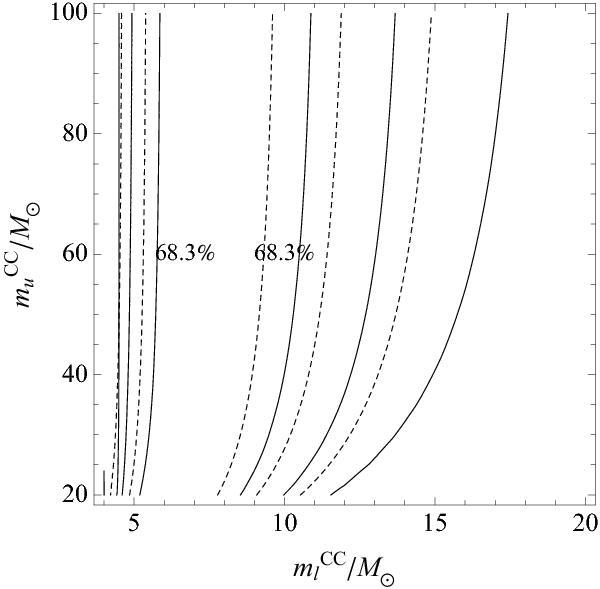
Probability density function of  and
and  , after marginalization over the SFR, for the B sample. The contours show the 68.3%, 95.4% and 99.7% confidence limits for two parameters, according to a frequentist approach. Thin and dashed lines are for NCC = 14 and 16, respectively. Values of masses are in solar units.
Current usage metrics show cumulative count of Article Views (full-text article views including HTML views, PDF and ePub downloads, according to the available data) and Abstracts Views on Vision4Press platform.
Data correspond to usage on the plateform after 2015. The current usage metrics is available 48-96 hours after online publication and is updated daily on week days.
Initial download of the metrics may take a while.