Fig. 6
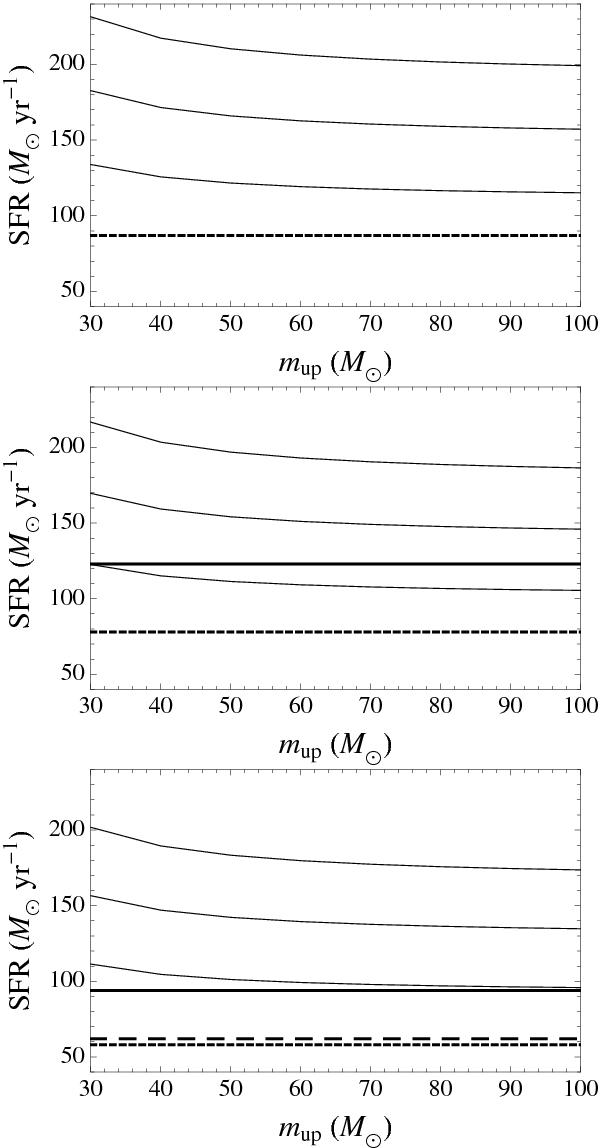
From the top to the bottom: the SFR expected from the CC SN rate in the sample A, B and C (thin lines) as a function of the upper mass limit for CC SN progenitors. We adopted a lower mass for CC SN progenitors of 8 M⊙. We plot the central value and 1σ confidence limits. The short dashed line indicates the value of SFR based on LHα (in all panels: sample A, B and C), the short dashed line the SFR based on LFUV (middle and bottom panels: samples B and C) and long dashed line the SFR based on LHα + LTIR (bottom panel: sample C).
Current usage metrics show cumulative count of Article Views (full-text article views including HTML views, PDF and ePub downloads, according to the available data) and Abstracts Views on Vision4Press platform.
Data correspond to usage on the plateform after 2015. The current usage metrics is available 48-96 hours after online publication and is updated daily on week days.
Initial download of the metrics may take a while.