Fig. 4
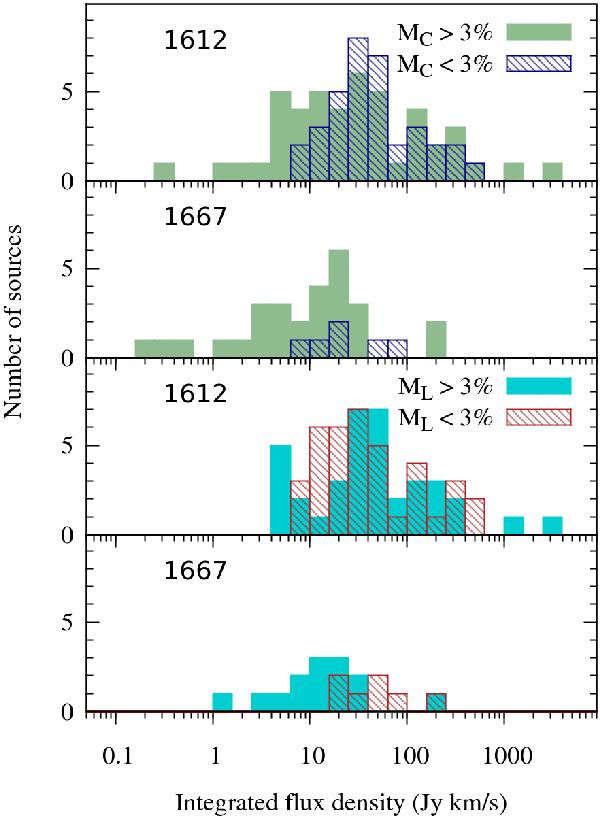
Histograms of all sources versus the integrated Stokes I flux density for weak and more strongly polarized 1612 and 1667 MHz lines. The fractional polarizations MC and ML are the ratios of the integrated flux densities. Note that there are statistically significant differences (p < 0.01) between the two distributions in each panel.
Current usage metrics show cumulative count of Article Views (full-text article views including HTML views, PDF and ePub downloads, according to the available data) and Abstracts Views on Vision4Press platform.
Data correspond to usage on the plateform after 2015. The current usage metrics is available 48-96 hours after online publication and is updated daily on week days.
Initial download of the metrics may take a while.