Fig. 2
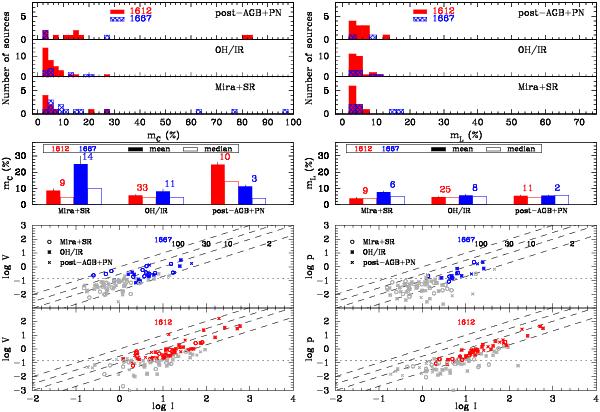
Polarization properties of OH emission in three classes of late-type stars. The flux density measurements are made at the Stokes I peak. Top: histograms of circular (mC) and linear (mL) fractional polarizations for each class of objects at both OH lines. Middle: mean and median values of the circular and linear fractional polarizations for three classes of objects. The number of objects for each class and OH line is given. Bottom: circularly polarized peak flux density (Stokes |V|) (left) and linearly polarized peak flux density (parameter p) (right) versus the total peak flux density (Stokes I) for the two OH lines. The coloured (online) symbols represent classes of objects while the grey symbols mark the sources with polarized emission lower than the individual detection level (3σ). The dotted lines show the mean upper limit 0.15 Jy. Some objects have much lower individual upper limits because they were observed longer. The dashed lines labelled 2, 10, 30 and 100 indicate the percentage of polarization.
Current usage metrics show cumulative count of Article Views (full-text article views including HTML views, PDF and ePub downloads, according to the available data) and Abstracts Views on Vision4Press platform.
Data correspond to usage on the plateform after 2015. The current usage metrics is available 48-96 hours after online publication and is updated daily on week days.
Initial download of the metrics may take a while.