Free Access
Fig. 1
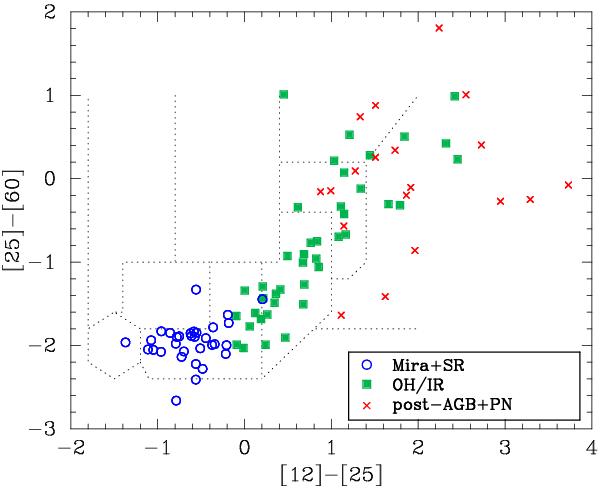
IRAS colour–colour diagram for the sample studied. The regions defined by van der Veen & Habing (1988) for different types of objects are marked by dotted lines. The three classes of objects discussed in the text can be distinguished by the symbols.
Current usage metrics show cumulative count of Article Views (full-text article views including HTML views, PDF and ePub downloads, according to the available data) and Abstracts Views on Vision4Press platform.
Data correspond to usage on the plateform after 2015. The current usage metrics is available 48-96 hours after online publication and is updated daily on week days.
Initial download of the metrics may take a while.