Fig. 9
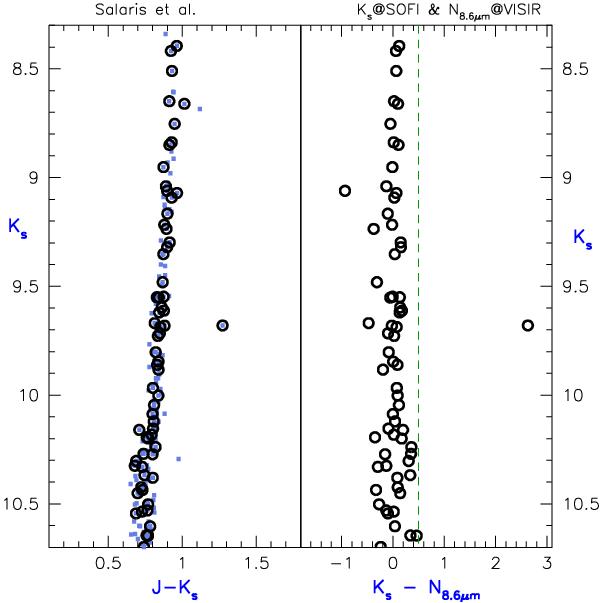
Left-hand panel: Ks, (J − Ks) SOFI based diagram by Salaris et al. Light symbols display the entire catalogue, while open circles highlight stars with VISIR counterparts. The right-hand panel displays the SOFI VISIR matched Ks, (Ks − N8.6 μm) diagram. For comparison, the vertical line at (Ks − N8.6 μm) = 0.5 marks the location of the majority of MIR-excess stars seen in Fig. 2 of Origlia et al. (2007).
Current usage metrics show cumulative count of Article Views (full-text article views including HTML views, PDF and ePub downloads, according to the available data) and Abstracts Views on Vision4Press platform.
Data correspond to usage on the plateform after 2015. The current usage metrics is available 48-96 hours after online publication and is updated daily on week days.
Initial download of the metrics may take a while.