Fig. 6
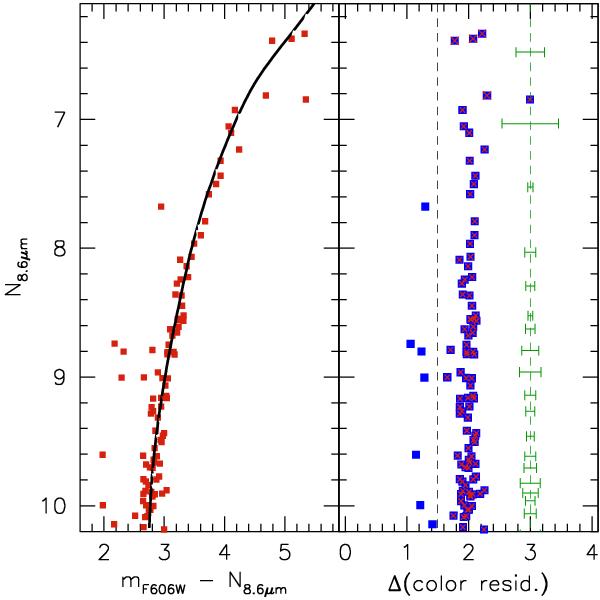
Estimating the width of the RGB. The left-hand panel displays the derived RGB mean loci. Stars with (mF606W − N8.6 μm) ≤ 1.5 were excluded in this count. The right-hand panel displays the straightened RGB sequence, along which a bin of fixed-number of stars (5) is used to estimate the mean colour dispersion. For clarity, these are shifted to a mean colour of 3.0.
Current usage metrics show cumulative count of Article Views (full-text article views including HTML views, PDF and ePub downloads, according to the available data) and Abstracts Views on Vision4Press platform.
Data correspond to usage on the plateform after 2015. The current usage metrics is available 48-96 hours after online publication and is updated daily on week days.
Initial download of the metrics may take a while.