Fig. 11
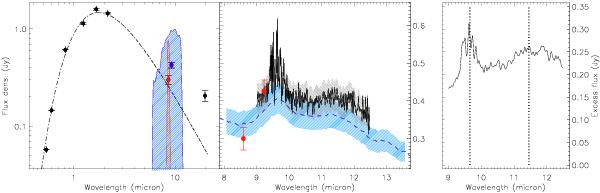
Left-hand panel: SED of V8: black filled circles correspond to the observed photometry at mF435W, mF606W, mF814W (from the HST) J, H, Ks (from 2MASS), N8.6 μm (from VISIR), plus 9 and 18 μm from AKARI. The dotted dashed black line is the best-fitting black-body with a temperature of of 2900 K. The VISIR N8.6 μm filter transmission curve is shown in red, while that of AKARI 9 μm is shown in shaded blue. The middle panel displays a comparison of the VISIR (solid black line) and IRS (dashed blue line) spectra. The shaded areas highlight the flux calibration uncertainties estimated for the two spectra. The right-hand panel shows the MIR excess for V8 (continuum subtracted spectrum) where the features at 9.7 and 11.5 μm are highlighted with vertical dotted lines.
Current usage metrics show cumulative count of Article Views (full-text article views including HTML views, PDF and ePub downloads, according to the available data) and Abstracts Views on Vision4Press platform.
Data correspond to usage on the plateform after 2015. The current usage metrics is available 48-96 hours after online publication and is updated daily on week days.
Initial download of the metrics may take a while.