Fig. 13
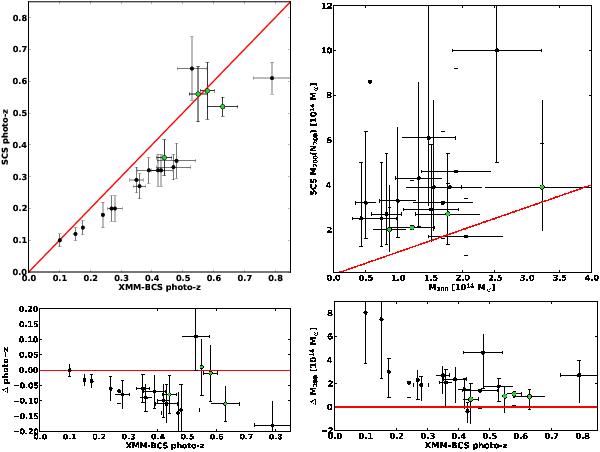
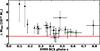
Top left: comparison of photometric redshifts for the 19 common clusters from our sample and the SCS cluster survey from Menanteau et al. (2009) and Menanteau et al. (2010). Top right: comparison of masses for the same cluster sample in the r200 aperture determined from the measured X-ray luminosity through scaling relations (x-axis) and the mean of the optically determined masses  ) and M(N200) (Table 5). The red line marks equality in both top panels. Bottom left: photo-z difference Δ = photo-z(SCS) − photo-z(XMM-BCS) as a function of our estimates of redshifts. Bottom right: M200 difference Δ = M200(SCS) − M200(XMM-BCS) as a function of our estimates of redshifts. The optical masses are significantly higher than the X-ray estimates especially at the low and high redshift ends. See text for discussion. Green points in all plots mark clusters from M10, black points those from M09.
Current usage metrics show cumulative count of Article Views (full-text article views including HTML views, PDF and ePub downloads, according to the available data) and Abstracts Views on Vision4Press platform.
Data correspond to usage on the plateform after 2015. The current usage metrics is available 48-96 hours after online publication and is updated daily on week days.
Initial download of the metrics may take a while.