Fig. 6
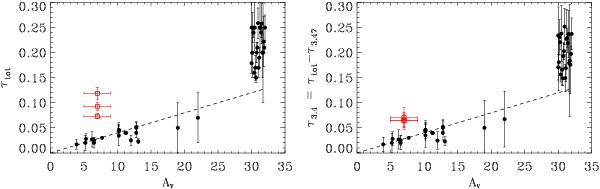
Optical depth of the C-H stretch band at 3.4 μm vs. visual extinction AV. The data obtained from this work are shown as red squares. The black filled circles are from McFadzean et al. (1989), Adamson et al. (1990), Sandford et al. (1991), Pendleton et al. (1994), Chiar et al. (2000), Chiar & Tielens (2001), Chiar et al. (2002), Rawlings et al. (2003), and Dartois et al. (2004). The various points associated with the Galactic centre sources have been slightly offset from each other in AV for clarity (see text for details). Left: the optical depths are τtot; i.e., they include the contribution of the 3.47 μm band. Right: the optical depths are τ3.4, due solely to the diffuse ISM (the estimated contributions of the 3.47 μm absorption have been subtracted). In both plots, the dashed line corresponds to the ratio AV / τ = 250 determined by Pendleton et al. (1994) in the local ISM. See the text for more details about the evaluation of the extinction toward S7, S10, and S11.

Current usage metrics show cumulative count of Article Views (full-text article views including HTML views, PDF and ePub downloads, according to the available data) and Abstracts Views on Vision4Press platform.
Data correspond to usage on the plateform after 2015. The current usage metrics is available 48-96 hours after online publication and is updated daily on week days.
Initial download of the metrics may take a while.