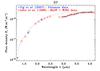
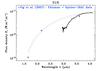
Fig. 1
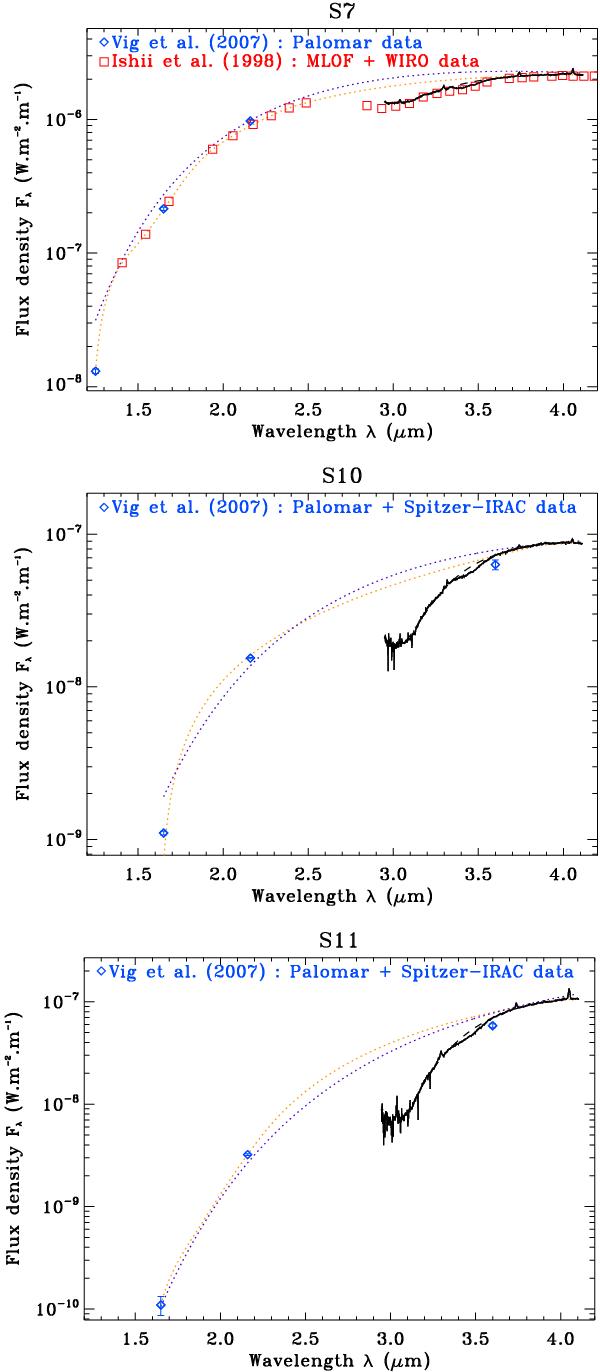
Spectra of lines of sight toward sources S7, S10, and S11. The blue diamonds and red squares represent the data from Vig et al. (2007) (Palomar and Spitzer-IRAC data) and from Ishii et al. (1998) (MLOF and WIRO data), respectively. The dotted lines represent the local continua for the 3.1 μm water ice absorption band. Two different continua are plotted to characterize the uncertainty of the ice band depth: a blackbody function and a spline interpolation are in purple and orange (dark and light grey in the printed version), respectively.
Current usage metrics show cumulative count of Article Views (full-text article views including HTML views, PDF and ePub downloads, according to the available data) and Abstracts Views on Vision4Press platform.
Data correspond to usage on the plateform after 2015. The current usage metrics is available 48-96 hours after online publication and is updated daily on week days.
Initial download of the metrics may take a while.