Fig. 6
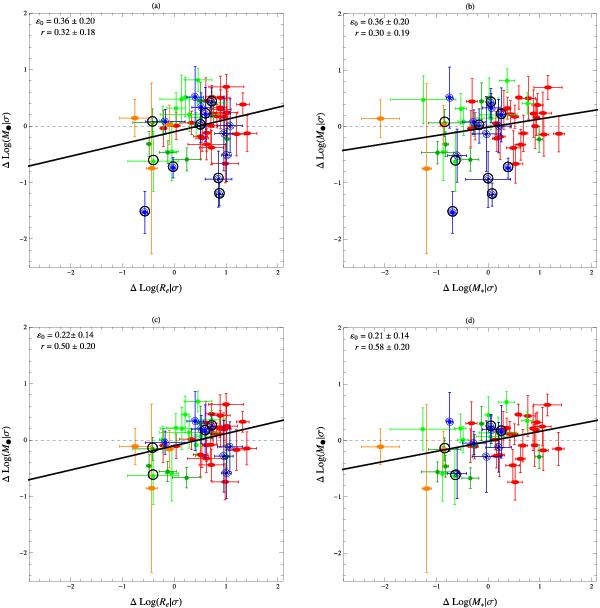
Correlations between the residuals in the M• − σ and Re − σ (left), and M ⋆ − σ (right) relations at each σ (Hopkins et al. 2007b), for the full sample of 57 galaxies (a–b), and for a more consistent sample (see text) of 52 galaxies (b–c). The corresponding intrinsic scatter and Pearson linear coefficient are reported in the upper-left corner of each plot. The symbols are the same as in Fig. 1. Galaxies inside the black circles are pseudo-bulges.
Current usage metrics show cumulative count of Article Views (full-text article views including HTML views, PDF and ePub downloads, according to the available data) and Abstracts Views on Vision4Press platform.
Data correspond to usage on the plateform after 2015. The current usage metrics is available 48-96 hours after online publication and is updated daily on week days.
Initial download of the metrics may take a while.