Fig. 8
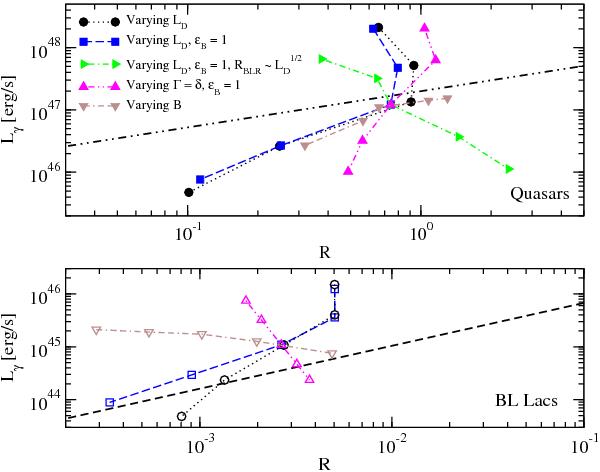
Model correlations of radio-optical loudness R vs. gamma-ray luminosity Lγ along sequences varying individual parameters. Each sequence represents the effect of a variation of one individual base parameter. The legend in the top left indicates the parameters varied along the sequences. Filled symbols indicate SEDs characteristic of FSRQs, while open symbols indicate sequences of SEDs characteristic of BL Lacs. The long-dashed and dot-dot-dashed lines mark the power-law correlations that best fit the observational data. The sequences marked in blue dashed line (squares), showing reasonable agreement with the best-fit correlations, correspond to the sequences of SEDs shown in Figs. 6 and 7 (see also Tables 2 and 3).
Current usage metrics show cumulative count of Article Views (full-text article views including HTML views, PDF and ePub downloads, according to the available data) and Abstracts Views on Vision4Press platform.
Data correspond to usage on the plateform after 2015. The current usage metrics is available 48-96 hours after online publication and is updated daily on week days.
Initial download of the metrics may take a while.