Fig. 4
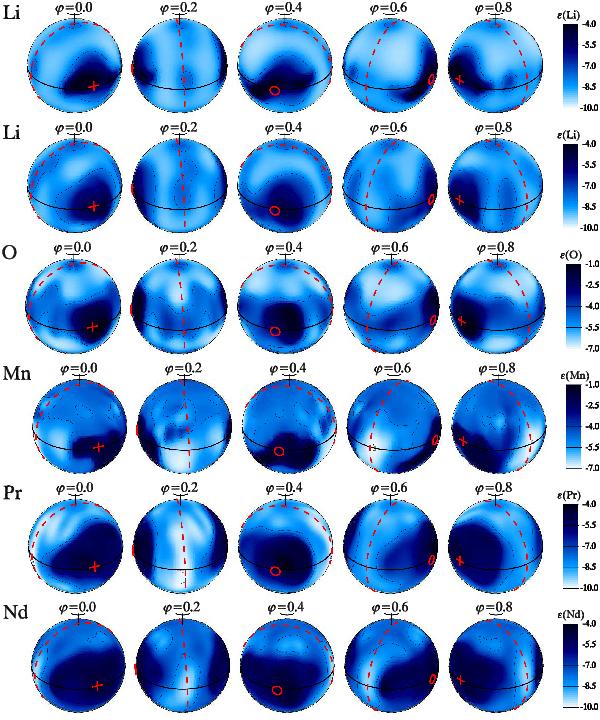
Abundance distributions of Li, O, Mn, Pr, and Nd at the surface of HD 3980 obtained from the lines listed in Table 2. The star is shown at five rotational phases. Darker areas correspond to the higher elemental abundances, the corresponding scale is given to the right of each panel and contours with equal abundances are plotted with steps of 1 dex. The circle and the cross indicate the position of the negative and the positive magnetic poles, respectively. This figure represents elements of Group 1 with enhanced spots centered on the magnetic poles. Two Li maps correspond (from top to bottom) to the cases of simultaneous mapping of Li i and Pr iii blend at 6707 Å, and additional implementation of Pr iii 7781.983 Å line (see text). Abundances are given in log (Nel/Ntotal).
Current usage metrics show cumulative count of Article Views (full-text article views including HTML views, PDF and ePub downloads, according to the available data) and Abstracts Views on Vision4Press platform.
Data correspond to usage on the plateform after 2015. The current usage metrics is available 48-96 hours after online publication and is updated daily on week days.
Initial download of the metrics may take a while.