Free Access
Fig. 5
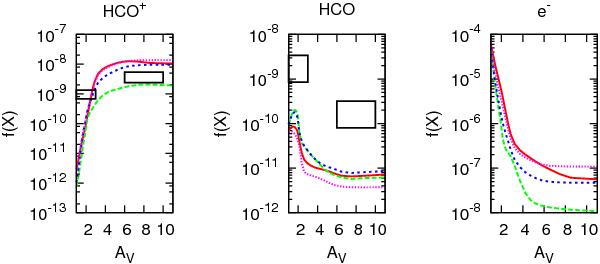
Relative abundances of HCO+, HCO and the ionization fraction as functions of AV. The boxes represent observations with error bars, and the lines are the model results for ζ = 10-17 s-1 (green dashed), ζ = 10-15 s-1 (pink dotted), and, from Fig. 2, the mid-range ζ(NH) ( blue dotted) and high-range ζ(NH) (red solid).
Current usage metrics show cumulative count of Article Views (full-text article views including HTML views, PDF and ePub downloads, according to the available data) and Abstracts Views on Vision4Press platform.
Data correspond to usage on the plateform after 2015. The current usage metrics is available 48-96 hours after online publication and is updated daily on week days.
Initial download of the metrics may take a while.