Fig. 3
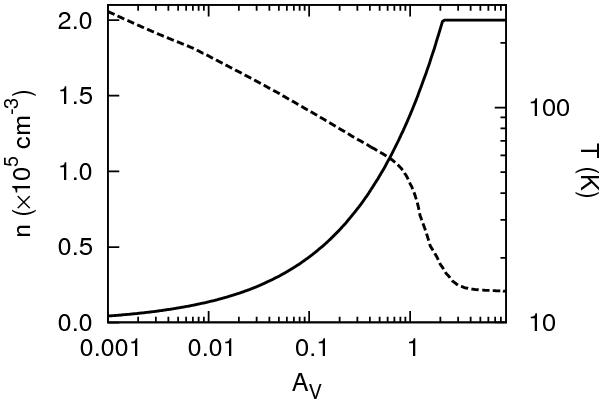
The temperature (dashed line) and density (solid line) profiles as functions of visual extinction with ζH,Nath. The density profile is in the form of Habart et al. (2005), our Eq. (11), with β = 1. The temperature is from thermal balance (Le Petit et al. 2006). At AV = 10, ζ ≈ 10-16 s-1, which raises the temperature by ≈ 4 K at the center compared to a ζ of 10-17 s-1.
Current usage metrics show cumulative count of Article Views (full-text article views including HTML views, PDF and ePub downloads, according to the available data) and Abstracts Views on Vision4Press platform.
Data correspond to usage on the plateform after 2015. The current usage metrics is available 48-96 hours after online publication and is updated daily on week days.
Initial download of the metrics may take a while.