Fig. 2
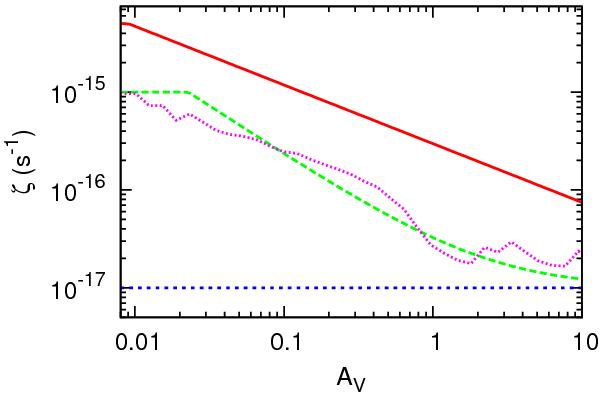
The results of the one-dimensional Monte Carlo model for ζ described in Sect. 2 in terms of AV. The solid red, dashed green, and dotted blue lines derive from the flux-spectra of Nath & Biermann (1994), Hayakawa et al. (1961), and Spitzer & Tomasko (1968), respectively. These lines fit the averaged result of dozens of iterations of the Monte Carlo model. The results from a single Monte Carlo run using the flux-spectrum of Hayakawa et al. (1961) are included (pink dotted) in order to show error.
Current usage metrics show cumulative count of Article Views (full-text article views including HTML views, PDF and ePub downloads, according to the available data) and Abstracts Views on Vision4Press platform.
Data correspond to usage on the plateform after 2015. The current usage metrics is available 48-96 hours after online publication and is updated daily on week days.
Initial download of the metrics may take a while.