Free Access
Fig. B.1
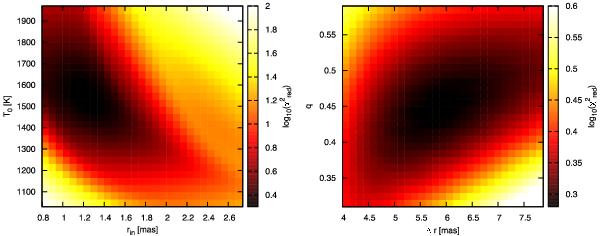
Reduced χ2-maps of the two-component temperature-gradient model. The  -value of each parameter combination in the maps represents the lowest -value of all other parameter combinations.
Current usage metrics show cumulative count of Article Views (full-text article views including HTML views, PDF and ePub downloads, according to the available data) and Abstracts Views on Vision4Press platform.
Data correspond to usage on the plateform after 2015. The current usage metrics is available 48-96 hours after online publication and is updated daily on week days.
Initial download of the metrics may take a while.