Fig. A.1
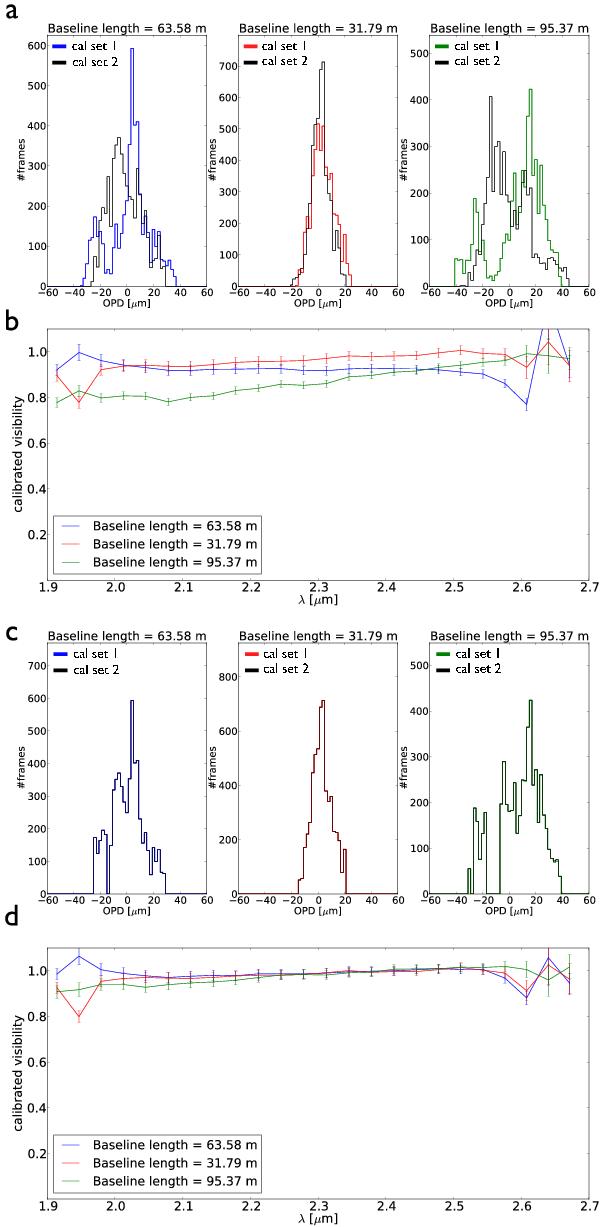
Test of the OPD histogram equalization with two different data sets of the calibrator HD 127 753. In this test, one of the two calibrator data sets plays the role of the “target data set”. One expects that a visibility value of 1.0 is derived for this “test target”, since the difference in the projected baselines of these two data sets is smaller than 1 m. a) OPD histograms of the two data sets (big histogram differences of the interferograms obtained with the 95 m baseline). b) Computed visibilities obtained without OPD histogram equalization (i.e., histogram in panel a; the 95 m baseline shows the biggest deviation from the expected value 1.0). c) OPD histogram obtained after the histogram equalization was applied to the data sets (equalization is only applied to OPD bins that contain more than 20% of the peak number of interferograms to reject bins with low SNR). d) Computed visibilities obtained after the OPD histogram equalization was applied.
Current usage metrics show cumulative count of Article Views (full-text article views including HTML views, PDF and ePub downloads, according to the available data) and Abstracts Views on Vision4Press platform.
Data correspond to usage on the plateform after 2015. The current usage metrics is available 48-96 hours after online publication and is updated daily on week days.
Initial download of the metrics may take a while.