Free Access
Fig. 3
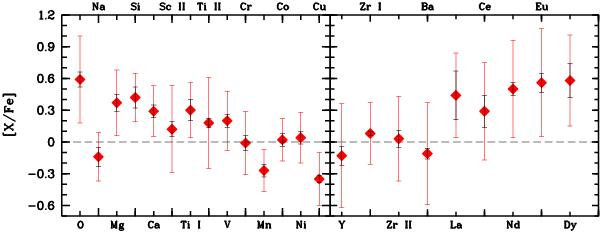
Mean abundance ratios of the Pal 14 giants of our sample. The black error bars indicate the standard deviations of the abundance ratios over the square root of the number of stars, ( ). The red error bars indicate the total errors, which involve the random and systematic uncertainties of the abundance ratios.
Current usage metrics show cumulative count of Article Views (full-text article views including HTML views, PDF and ePub downloads, according to the available data) and Abstracts Views on Vision4Press platform.
Data correspond to usage on the plateform after 2015. The current usage metrics is available 48-96 hours after online publication and is updated daily on week days.
Initial download of the metrics may take a while.