| Issue |
A&A
Volume 537, January 2012
|
|
|---|---|---|
| Article Number | C5 | |
| Number of page(s) | 2 | |
| Section | Interstellar and circumstellar matter | |
| DOI | https://doi.org/10.1051/0004-6361/201016340e | |
| Published online | 25 January 2012 | |
Coupled blind signal separation and spectroscopic database fitting of the mid-infrared PAH features (Corrigendum)⋆
1 Sterrewacht Leiden, Universiteit Leiden, Niels Bohrweg 2, 2333 CA Leiden, The Netherlands
e-mail: This email address is being protected from spambots. You need JavaScript enabled to view it.
2 The International Space University, Parc d’Innovation, 1 rue Jean Dominique Cassini, 67400 Illkirch Graffenstaden, France
3 NASA Ames Research Center, Space Science Division, Mail Stop 245-6, Moffett Field, CA 94035, USA
e-mail: This email address is being protected from spambots. You need JavaScript enabled to view it.
; This email address is being protected from spambots. You need JavaScript enabled to view it.
Key words: astrochemistry / infrared: ISM / ISM: lines and bands / photon-dominated region (PDR) / Errata, addenda
This work is based on observations made with the Spitzer Space Telescope, which is operated by the Jet Propulsion Laboratory, California Institute of Technology under a contract with NASA.
1. Erratum
The original paper contained erroneous data in Fig. 10. The correct figure is presented here. None of the conclusions are substantially affected.
Figure 10 displays a linear correlation between the [11.0]/[11.2] μm PAH emission line ratio and the [6.2]/[11.2] μm ratio. To measure the [6.2]/[11.2] μm ratio, the low-resolution IRS spectra were used to measure the flux of the 6.2 μm feature, and the high-resolution spectra to measure the 11.2 μm band flux. As noted in the text, this was chosen because the [11.0] μm contribution cannot be differentiated from the [11.2] μm emission using the low-resolution module. However, upon inspection, we have found that the low-resolution and high-resolution IRS modules are not calibrated correctly with respect to each other. There is on average a factor of ~2 difference in the absolute intensity between low and high-resolution spectra in the 9–14 μm range.
Although the exact origin of this calibration problem is beyond the scope of this paper, we believe it comes from the extended nature of the emission in NGC 7023-NW. This PDR has many bright filaments and complex spatial structures that are unresolved by the IRS instrument. The difference in aperture size between the low and high-resolution modes, namely (1.8″)2 for high and (2.3″)2 for low, could account for this factor of two difference between the modules. Comparing IRS low-resolution spectral mapping with IRAC 8 μm image also shows a large discrepancy in the observed integrated intensities.
Once this cross-calibration problem between the high and low resolution modules of IRS is apparent, we must alter our method of measuring the ratios. For the [6.2]/[11.2] μm ratio, it is necessary to measure both the [6.2] and [11.2] μm bands with the same module (i.e. IRS-SL), so the calibration offset is normalized. However, this presents the problem of the 11.0 μm PAH+ contamination, since the 11.0 μm contribution cannot be resolved in the low-resolution mode. This can be corrected for using the high-resolution [11.0]/[11.2] μm ratio. The integrated intensity in the 11.2 band, I11.2, can be expressed independantly of the SH/SL calibration by 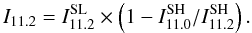 (1)A new plot has been created using the new I11.2 and is shown in Fig. 1. The low signal-to-noise ratio points ( ≤ 25% of maximum flux) were removed and the remaining points were fit with a least squares linear regression. The revised empirical relation is
 ![Mathematical equation: \begin{equation} \frac{[11.0 ~\mu {\rm m}]}{[11.2~\mu {\rm m}]}=0.084\times\left ( \frac{[6.2~\mu {\rm m}]}{[11.2~\mu {\rm m}]} \right ) - 0.06. \end{equation}](/articles/aa/full_html/2012/01/aa16340e-10/aa16340e-10-eq10.png) (2)We note that this relation does not go through (0, 0). This implies that there is 6.2 μm emission even if there is no 11.0 μm band. Recalling that the 6.2 μm band may have a (weak) contribution from neutral PAHs, while the 11.0 μm band is “pure” cation, we suggest that the 11.0 μm band may be a better tracer of the presence of PAH cations in space. Further studies will have to validate this statement.
(2)We note that this relation does not go through (0, 0). This implies that there is 6.2 μm emission even if there is no 11.0 μm band. Recalling that the 6.2 μm band may have a (weak) contribution from neutral PAHs, while the 11.0 μm band is “pure” cation, we suggest that the 11.0 μm band may be a better tracer of the presence of PAH cations in space. Further studies will have to validate this statement.
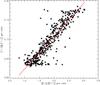 |
Fig. 1 The [6.2]/[11.2] μm vs. the [11.0]/[11.2] μm PAH band integrated intensity ratio in NGC 7023-NW. The 11.2 μm and 11.0 μm measurements were made using the IRS-SH observations, while the [6.2]/[11.2] μm ratio was measured using the IRS-SL observations (see text for details). The instrumental error is comparable to the symbol size. |
© ESO, 2012
All Figures
|
Fig. 1 The [6.2]/[11.2] μm vs. the [11.0]/[11.2] μm PAH band integrated intensity ratio in NGC 7023-NW. The 11.2 μm and 11.0 μm measurements were made using the IRS-SH observations, while the [6.2]/[11.2] μm ratio was measured using the IRS-SL observations (see text for details). The instrumental error is comparable to the symbol size. |
| In the text | |
Current usage metrics show cumulative count of Article Views (full-text article views including HTML views, PDF and ePub downloads, according to the available data) and Abstracts Views on Vision4Press platform.
Data correspond to usage on the plateform after 2015. The current usage metrics is available 48-96 hours after online publication and is updated daily on week days.
Initial download of the metrics may take a while.