Free Access
Fig. 5
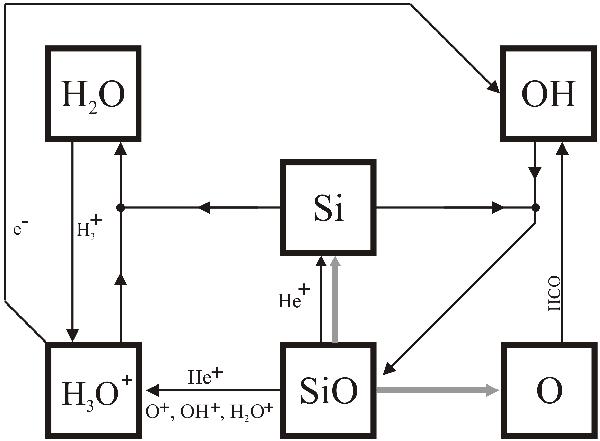
Final (107 yr) chemical network for H2O at P1 in Fig. 1 (n ⟨ H ⟩ = 1010 cm-3 and T = 20 K). The lines represent reactions between species on the diagram, with arrows pointing at the product(s) of each reaction. Gray lines: Cosmic ray-induced photo-dissociation reactions.
Current usage metrics show cumulative count of Article Views (full-text article views including HTML views, PDF and ePub downloads, according to the available data) and Abstracts Views on Vision4Press platform.
Data correspond to usage on the plateform after 2015. The current usage metrics is available 48-96 hours after online publication and is updated daily on week days.
Initial download of the metrics may take a while.