Fig. 1
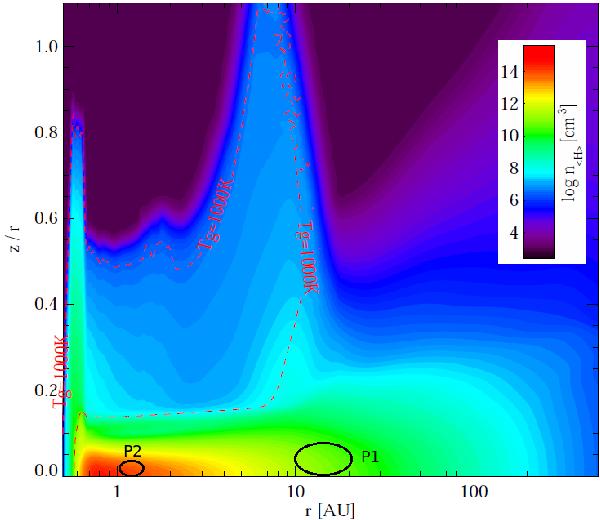
Density structure (total hydrogen nuclei number density n ⟨ H ⟩ ) of a T Tauri disk model as function of radial distance from the star r and the relative height z/r. Gas in thermal balance. The red dashed line shows the temperature boundary where Tg = 1000 K. The regions under consideration for this paper are shown as black ovals (P1, and P2 for benchmarking). This figure is taken from the ProDiMo simulation (Woitke et al. 2009).
Current usage metrics show cumulative count of Article Views (full-text article views including HTML views, PDF and ePub downloads, according to the available data) and Abstracts Views on Vision4Press platform.
Data correspond to usage on the plateform after 2015. The current usage metrics is available 48-96 hours after online publication and is updated daily on week days.
Initial download of the metrics may take a while.