Fig. 2
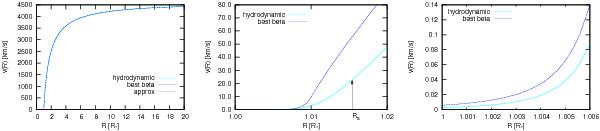
A comparison between the best-β and hydrodynamic velocity laws for an O3 V star. Here, the best-β velocity law is the one determined by using the fit-parameters of the hydrodynamic solution. The label “approx” in the left panel refers to the approximate velocity law, as given by Eq. (12). Three different radial regimes are plotted: full radial range (left panel); the region around the sonic point (middle panel) in which the location of the sonic point in the hydrodynamic solution is indicated with an arrow, and the photospheric region (right panel). Note that at high velocities both methods, as well as the approximate velocity law, yield very similar velocity stratifications. Near the sonic point the best-β velocity law is steeper than the hydrodynamic velocity law. Its sonic point is closer to the star. Given this difference, the right panel shows that in the photosphere where hydrostatic equilibrium controls the equation of motion, the shape of both velocity profiles is very similar.
Current usage metrics show cumulative count of Article Views (full-text article views including HTML views, PDF and ePub downloads, according to the available data) and Abstracts Views on Vision4Press platform.
Data correspond to usage on the plateform after 2015. The current usage metrics is available 48-96 hours after online publication and is updated daily on week days.
Initial download of the metrics may take a while.