Free Access
Fig. 6
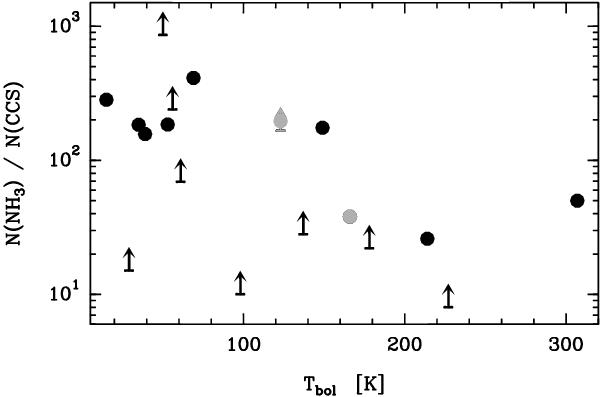
Abundance ratio NNH3/NCCS versus bolometric temperature of embedded sources. Arrows indicate lower limits to the abundance ratio, gray symbols mark Tbol of combined spectral energy distributions (cf. Sect. 5.3).
Current usage metrics show cumulative count of Article Views (full-text article views including HTML views, PDF and ePub downloads, according to the available data) and Abstracts Views on Vision4Press platform.
Data correspond to usage on the plateform after 2015. The current usage metrics is available 48-96 hours after online publication and is updated daily on week days.
Initial download of the metrics may take a while.