Fig. 4
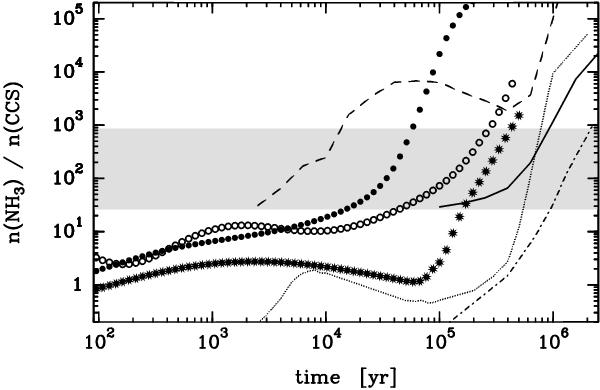
NH3/CCS ratio from the chemical model calculations (see Sect. 5.2) of Suzuki et al. (1992, dash-dotted line), Scappini et al. (1998, dashed line), Bergin (2000, solid line), and Aikawa et al. (2001, dotted line), and this work (10 K warm group − I model marked with open circles, 15 K group 0 model with filled circles and 25 K group I model with asterisks). The observed range of NNH3/NCCS is designated by the shaded area.
Current usage metrics show cumulative count of Article Views (full-text article views including HTML views, PDF and ePub downloads, according to the available data) and Abstracts Views on Vision4Press platform.
Data correspond to usage on the plateform after 2015. The current usage metrics is available 48-96 hours after online publication and is updated daily on week days.
Initial download of the metrics may take a while.