Fig. 9
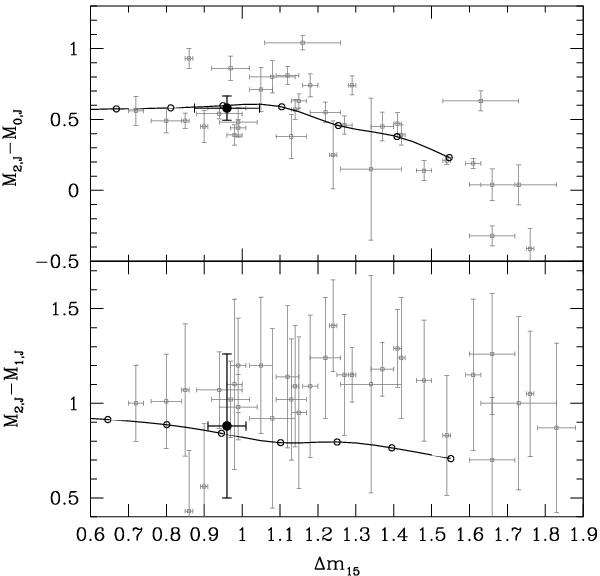
Strength of the secondary maximum in the J-band as a function of the decline rate Δm15(B). The symbols are the same as in Fig. 8. The lower panel shows the difference in magnitudes between the secondary maximum and the primary maximum, while the upper panel displays the difference in magnitudes between the secondary maximum and the local minimum. In each panel, the same quantities predicted by Kasen (2006) models are plotted for comparison.
Current usage metrics show cumulative count of Article Views (full-text article views including HTML views, PDF and ePub downloads, according to the available data) and Abstracts Views on Vision4Press platform.
Data correspond to usage on the plateform after 2015. The current usage metrics is available 48-96 hours after online publication and is updated daily on week days.
Initial download of the metrics may take a while.