| Issue |
A&A
Volume 536, December 2011
|
|
|---|---|---|
| Article Number | L5 | |
| Number of page(s) | 4 | |
| Section | Letters | |
| DOI | https://doi.org/10.1051/0004-6361/201118018 | |
| Published online | 07 December 2011 | |
Letter to the Editor
Dense gas without star formation: the kpc-sized turbulent molecular disk in 3C 326 N⋆
1
Institut d’Astrophysique Spatiale, CNRS, Université Paris-Sud, 91405 Orsay, France
e-mail: This email address is being protected from spambots. You need JavaScript enabled to view it.
2
GEPI, Observatoire de Paris, CNRS, Université Denis Diderot, 5 place Jules Janssen, 92195 Meudon, France
3
Spitzer Science Center, IPAC, California Institute of Technology, Pasadena, CA 92215, USA
4
LERMA Observatoire de Paris, CNRS, 61 rue de l’Observatoire, 75014 Paris, France
Received: 5 September 2011
Accepted: 21 October 2011
Abstract
We report the discovery of a 3 kpc disk of few 109 M⊙ of dense, warm H2 in the nearby radio galaxy 3C 326 N, which shows no signs of ongoing or recent star formation and falls a factor of 60 below the Schmidt-Kennicutt law. Our VLT/SINFONI imaging spectroscopy shows broad (FWHM ~ 500 km s-1) ro-vibrational H2 lines across the entire disk, with irregular profiles and line ratios consistent with shocks. The ratio of turbulent to gravitational energy suggests that the gas is highly turbulent and not gravitationally bound. In the absence of the driving by the jet, the short turbulent dissipation times indicate that the gas should collapse rapidly and form stars, at odds with the recent star-formation history. Motivated by hydrodynamic models of rapid H2 formation boosted by turbulent compression, we propose that the molecules formed from diffuse atomic gas in the turbulent jet cocoon. Since the gas is not self-gravitating, it cannot form molecular clouds or stars while the jet is active, and is likely to disperse and become atomic again after the nuclear activity ceases. We speculate that very low star-formation rates are to be expected under such conditions, provided that the large-scale turbulence controls the gas dynamics in molecular clouds. Our results illustrate that jets may create large molecular reservoirs as expected in “positive feedback” scenarios of AGN-triggered star formation, but that this alone is insufficient to trigger star formation.
Key words: galaxies: jets / galaxies: active / galaxies: ISM / galaxies: individual: 3C 326 N
Based on observations carried out with the Very Large Telescope of ESO under program ID 385.B-0809.
© ESO, 2011
1. Introduction
The radio galaxy 3C 326 N at z = 0.1 is an excellent target to investigate how the mechanical energy output of radio-loud AGN affects the surrounding gas and star formation. In spite of a few × 109 M⊙ of dense H2, akin to LIRGs, the star-formation rate (SFR ≤ 0.07 M⊙ yr-1Ogle et al. 2007) is orders of magnitude lower than expected from the Schmidt-Kennicutt law (Nesvadba et al. 2010, N10 hereafter). With such a low SFR, an X-ray faint AGN (log ℒX = 40.6 erg s-1Ogle et al. 2010), and a strong radio source (kinetic power log ℒkin ≥ 44.6 erg s-1, N10), 3C 326 N provides a rare opportunity to clearly disentangle the effects of the jet from those of star formation and AGN radiation. It is one of the largest and oldest radio galaxies in the sky, with a 2 Mpc size, dynamical and spectral ages of 6–20 × 107 yrs (Willis & Strom 1978), and a radio core at 3 mm (N10). The galaxy 3C 326 N is not an obvious member of a group or cluster, but has a similarly old ( ≥ 10 Gyr), massive (Mstellar = few × 1011 M⊙) companion at a projected distance of ~20 kpc.
3C 326 N is amongst the 30% of nearby 3CR radio galaxies that have bright line emission from warm molecular hydrogen observed with Spitzer/IRS and line ratios consistent with shocks (Ogle et al. 2010). The gas kinetic energy and line luminosities exceed the energy injection rates from star formation and AGN radiation, making the deposition of mechanical energy by the radio source the only plausible culprit (N10). This energy injection does not only trigger an outflow, but also heats the ambient gas through shocks. The turbulent kinetic energy roughly equals the bulk kinetic energy of the outflowing gas. About half the molecular gas in 3C 326 N is warm (T > 100 K), a fraction which is 100 × greater than in star-forming galaxies, suggesting that mechanical heating by the jet could be an important mechanism of suppressing the overall star formation in this galaxy.
We present deep imaging spectroscopy of the ro-vibrational H2 emission lines at R = 3000 and 0.7′′ spatial resolution, which probes the spatially resolved gas properties and kinematics, and significantly enhances and complements the analysis of N10 that relied on unresolved Spitzer/IRS spectroscopy at R = 120 (2500 km s-1) with 5′′ spatial resolution. We find a kpc-sized rotating, turbulent disk with broad complex line profiles, suggesting that the mechanical energy deposition of the jet is not restricted to a small part of the disk. We argue that finding such a disk is difficult to reconcile with the recent star-formation history of 3C 326 N unless the molecular gas formed in response to the turbulence created by the radio jet, indicating a close symbiosis between jet and molecular gas, but also suggesting that boosting the formation of molecular gas in turbulent jet cocoons is insufficient to trigger star formation as often assumed in models of positive AGN feedback. Throughout the paper, we adopt a H0 = 70 km s-1, ΩM = 0.3, ΩΛ = 0.7 cosmology.
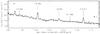 |
Fig. 1 Integrated K-band spectrum of 3C 326 N. The properties of labeled lines are listed in Table 1. |
Line properties derived from the “stacked” spectrum, i.e., the integrated spectrum with the large-scale velocity gradient removed.
2. The molecular gas in 3C 326 N
Data were obtained with the near-infrared imaging spectrograph SINFONI (Bonnet et al. 2004) at the Very Large Telescope of ESO with a total of 15 000 s of on-source observing time in the K-band at a seeing-limited resolution of FWHM = 0.75′′ × 0.65′′. Our data reduction and calibration methods are described by Nesvadba et al. (2008, 2011a,b). The integrated spectrum of 3C 326 N (Fig. 1) is dominated by the ro-vibrational H2 lines H2 1-0 S(1) to S(4) (S(1)-S(4) hereafter). The Paα emission is very weak, Paα/S(3) = 0.5 (Table 1).
Several arguments show that this gas is heated by shocks, similar to the pure-rotational H2 and optical lines (N10). First, S(3)/Paα and S(1)/Brγ ratios are factors of ten greater than the typical S(1)/Brγ ~ 0.1−1.5 in star-forming galaxies dominated by UV heating (Puxley et al. 1990). Since we do not detect Brγ, we estimate that S(1)/Brγ = 18–22 from the Paα flux, adopting a line decrement Paα/Brγ = 12–14. This exceeds typical ratios in star-forming galaxies by a factor of ten. Second, for star formation we expect ratios of the H2 2-1/ H2 1-0 S(3) lines that are factors of a few greater than the 3σ upper limit of 0.12 for S(1) and S(3) (Le Petit et al. 2006,see Herrera et al. 2011 for a similar analysis). A third diagnostic is the [OI]λ6300/Hα ratio as a function of S(1)/Brγ (Mouri et al. 1989). For the [OI]λ6300/Hα ratio of N10, the S(1)/Brγ ratio in 3C 326 N exceeds that expected from star formation by a factor of ten. Forthly, the H2 line luminosity of S(1)-S(3) is 1 × 1041 erg s-1, which exceeds the X-ray luminosity of the AGN and the mechanical luminosity of star formation (N10), leaving shock heating by the jet as the only plausible culprit.
Both the Paα and H2 morphologies are disk-like and extend over 2.0′′ × 1.1′′ (3.2 kpc × 1.8 kpc) at PAmorph = 0 ± 20°. All H2 lines and Paα are broad, with a FWHM ~ 400–700 km s-1, down to the limit of our spatial resolution. They have irregular profiles (Fig. 2) that cannot be fitted with single Gaussians. To map the kinematics, we therefore measure the width, Wp, and central wavelength, Cp, of each line at p = 0.2, 0.5, 0.7, and 0.9 times the line core extracted from small apertures of 0.4′′ × 0.4′′ (Heckman et al. 1981). The parameter W50 corresponds to the FWHM, whereas C90 approximates the line core. For S(3), we also measure the asymmetry parameter A20, i.e., the shift of C20 relative to C90 (Fig. 2 of Heckman et al. 1981). Both S(1) and Paα have telluric absorption features along their wings, which makes measuring A20 difficult, although their C90 and W50 measurements here are consistent with S(3).
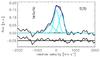 |
Fig. 2 Emission-line profile of H2 1–0 S(3) extracted from a 0.6′′ × 0.6′′ aperture on the northern disk (black line) fit with 3 Gaussian components (light blue line). The fit residual is shown below. |
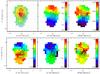 |
Fig. 3 (top, left to right) Maps of the line fluxes, relative velocities, and FWHMs of H2 1–0 S(3) in km s-1. (bottom, left to right) Line asymmetry of the 20-percentile for S(1), S(3), and Paα, respectively, in km s-1. Contours mark the continuum peak. |
Velocities increase monotonically from SSW to NNE along PA = 345° ± 15° (Fig. 3) for all percentiles and all lines. Lines are broadest NE of the nucleus (W50,H2 ≤ 650 km s-1, W50, PA ≤ 750 km s-1), and more narrow in the south (300–400 km s-1 for all lines). A Fourier analysis of non-circularities in the velocity map with Kinemetry (Krajnović et al. 2006) suggests that the velocity gradient is indistinguishable from rotation with PAkin = 340°, inclination i = 35°, and a deprojected circular velocity of vc = 1/2 Δvproj csci = 290 km s-1. This would imply a dynamical mass  somewhat higher than the enclosed stellar mass of Mstel = 2 × 10¹⁰ M⊙. (The enclosed stellar mass is derived from the total stellar mass of 3 × 10¹¹ M⊙ (N10) for a mass profile consistent with a Hubble law.) The non-Gaussian line profiles suggest that there are non-circular velocity components that are probably smoothed out by the low spatial resolution. This could affect the velocity gradient.
The FWHMs are larger than the velocity gradient, hence the broad lines cannot be artifacts of the velocity gradient and beam smearing, in which case most of the broadening should be near the nucleus, contrary to Fig. 3. The analysis of a toy data cube with constant FWHM = 400 km s-1 and a gradient as observed suggests that beam smearing accounts for ≤ 15% of the FWHM (similar to our 1σ observational errors). We also used a toy data cube to quantify the contribution of rotation to the CO(1–0) line measured by N10, which has a FWHM = 350 km s-1. We find a minimal intrinsic line width of 250 km s-1 assuming that the CO has the same velocity gradient as H2 and Paα and a uniform surface brightness.
The small ratios of vc/σ = 1.7 − 0.9 (with velocity dispersion σ = FWHM/2.355 = 170 − 270 km s-1, Fig. 3) imply an ellipsoidal configuration rather than a thin disk. Broad lines across all of the disk show that the mechanical energy of the AGN affects the gas globally. This differs strongly from the scenario of jet-cloud interactions that are confined to gas in small areas along the jet axis and is more akin to recent hydrodynamic models of jet cocoons where radio-emitting plasma permeates inhomogeneous gas disks along relatively low-density channels (Sutherland & Bicknell 2007; Wagner & Bicknell 2011).
The H2 emission lines in 3C 326 N have blue asymmetries that are strongest in the north (A20 = −150 km s-1, where turbulent velocities are also largest). The H2 emission has velocities of up to − 1000 km s-1 from C90, well above the local escape velocity, which is  km s-1 at the largest H2 radii. We also find that vesc is very similar to the smallest FWHMs in the south. Figure 2 suggests that of-order 10% of the emission originates from gas at v > vc. Since the V(1-0) H2 lines only probe the warmest, but not the bulk of the gas, this is difficult to turn into a mass outflow rate Ṁ. If we assume that the pure-rotational lines, which trace most of the mass, have a similar profile (as reported for AGN with high-resolution Spitzer spectroscopy, Dasyra & Combes 2011; Guillard et al. 2011), we find ~ 1 × 10⁸ M⊙ of entrained dense, warm H2 in the wind. For an outflow timescale of 107 − 8 yrs, this is consistent with or less than the Ṁ estimated from Na D, 30–40 M⊙ yr-1 (N10), which traces neutral (atomic and/or molecular) gas down to lower column densities.
3. Jet-disk symbiosis
The gas in 3C 326 N is contained in a kpc-sized, dense, thick disk. The broad line widths and complex profiles are inconsistent with pure rotation, but require an additional source of turbulence, which, following the energy arguments of N10, can only be the radio source. A fraction of the line emission originates from gas with velocities above the local escape velocity. The rotational time of this disk, τrot = 2πR/vc = 3 × 10⁷ yrs, is shorter than the 6 − 20 × 107 yrs age of the radio source, and comparable to the depletion time of the gas through the wind, τwind = M/Ṁ ~ 5 × 10⁷ yrs. It is also very similar to the dissipation time of turbulent energy τdiss = Rdisk/σCO = 1.5 × 10⁷ yrs. The similar timescales raise two major questions.
First, why do we find a fairly organized (albeit thick) disk, if the depletion time through the wind is short? The mass outflow rate of N10 may be uncertain to about an order of magnitude, but even if it were a factor ten lower, much of the gas should have been removed in the 2 × 10⁸ yrs time span suggested by the oldest radio emission (Sect. 1). Finding a disk associated with an old radio source such as 3C 326 requires that energy losses are roughly balanced by the injection of energy, and the entrained by cooling gas. This would imply that a fraction of the outflowing gas does not escape from the galaxy, but dissipates its kinetic energy, stalls, and rains back onto the disk in a cycle that may be akin to “cold feedback” models of galaxy clusters (Ciotti et al. 1991; Pizzolato & Soker 2005; Brighenti & Mathews 2006).
Second, with τdiss ~ τrot the H2 disk cannot be stable in the absence of the jet. The absence of a gas-rich merger suggests that the material accumulated gradually by means of mass return and accretion over ≳ few × 109 yrs (N10), which is longer than the age of the radio jet. Collisions between clouds would rapidly dissipate the turbulent kinetic energy and the angular momentum of the disk in about one to a few rotational times (Verdoes Kleijn et al. 2006; Pizzolato & Soker 2010), which is consistent with our estimates. For the measured gas surface density of Σgas = 250 M⊙ pc-2, the Schmidt-Kennicutt law implies that SFR = 4.5 M⊙ yr-1. This is about 60 times greater than the upper limit of SFR = 0.07 M⊙ yr-1 (Ogle et al. 2007) inferred from Spitzer 70 μm imaging1, and at odds with the recent star-formation history of 3C 326 N. To quantify the recent star formation, we repeated the population synthesis analysis of the inner 3′′ of 3C 326 N from N10, this time adding small fractions of light from young (3–30 × 107 yrs) stellar populations (YSPs) to the data. We found that, for SFR = 4.5 M⊙ yr-1 stars must form for a few 105 yrs to produce detectable signatures. This is very short, hence, the absence of recent star formation suggests that the gas cannot have lost turbulent support for much longer than a free-fall time (106 yrs for N = 103 cm-3) in the last 300 Myr. Unless the jet has been nearly continuously active during this time (which is longer than the oldest estimate of the jet age and unlike many other giant radio galaxies with signs of repeated, shorter jet outbreaks, Schoenmakers et al. 2000), then why has this gas not been forming stars?
Resolving this paradox is possible if the molecules formed after the onset of AGN activity, boosted by the turbulence in the jet cocoon. Hydrodynamic simulations suggest that turbulent compression can turn a diffuse inhomogeneous, largely atomic medium within few 106 yrs into a warm, largely molecular medium (Glover & Mac Low 2007). Molecules form in rather dense regions (n ≥ 1000 cm-3) and are transported to regions of lower density. The total amount of H2 on macro-scales is set by the dynamic equilibrium of the rapid molecule formation and destruction on micro-scales. This gas would not be gravitationally bound and be part of a turbulent multiphase medium, where warm H2 becomes a major gas coolant (Guillard et al. 2009).
In this scenario, the molecular gas only survives the radio phase if it forms self-gravitating clouds while pressurized by the cocoon. Otherwise, with decreasing pressure H2 formation rates drop, and the dynamic equilibrium between molecule formation and destruction is no longer maintained. The gas again becomes atomic. Extended reservoirs of diffuse atomic gas are not unusual in early-type galaxies (Oosterloo et al. 2007). Dust lanes in radio galaxies are often perpendicular to the jet (de Koff et al. 2000), and have masses that depend on jet power (de Ruiter et al. 2002), suggesting that the ISM “knows about the jet”.
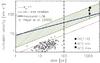 |
Fig. 4 Turbulent velocity as a function of size. Black symbols show our data for CO, H21–0 lines, and Paα, respectively. The red dotted line is for αvir = 1 for a constant mass-surface density Σgas = 250 M⊙ pc-2 and the green hatched region shows the range implied by Larson’s scaling law and the range of velocities measured on kpc scales. Black circles show the molecular clouds of Heyer et al. (2009). These points fall near the αvir = 1 relation for gas surface densities ~5 smaller than that of 3C 326 N. The horizontal dot-dashed line shows the maximal clump size of ~100 pc. See Sect. 4 for details. |
4. Turbulence in 3C 326 N and star formation
To understand more clearly how AGN and star formation in 3C 326 N may be related, we now argue that turbulence governs the gas dynamics in 3C 326 N down to the length scales of molecular clouds. In this case, finding star formation rates as low as those observed may not be so surprising after all. We quantify the ratio of turbulent to gravitational energy in terms of the virial parameter,  (Bertoldi & McKee 1992), where Σcl and Rcl are the mass surface density and radius of individual clouds, respectively, and G is the gravitational constant. Gravitationally bound clouds have αvir ≤ 1. Hydrodynamic simulations suggest that column densities created by turbulent motion cannot greatly exceed the mean column density (e.g., Ostriker et al. 2001). We therefore use the measured Σgas = 250 M⊙ pc-2 (Sect. 2).
The H2 line emission in 3C 326 N is powered by the dissipation of turbulent energy, which implies that  (McKee & Ostriker 2007), where LH2 and MH2 are the H2 luminosity and mass. N10 find that LH2/MH2 ~ 0.06 L⊙/M⊙. The correction factor fH2 ≲ 1 is necessary because H2 is the dominant, but not the only gas coolant (see also Herrera et al. 2011). We adopt fH2 = 0.5. Turbulent velocities do not scale arbitrarily with size, but approximately follow a power law σ ∝ R0.5, as observed for molecular clouds in the Milky Way (e.g., Larson 1981) and seen in hydrodynamic simulations including simulations of jet cocoons (Krause & Alexander 2007).
Figure 4 illustrates that for all cloud sizes ≲ 1 kpc, the observed L/M implies line widths that are at least a factor of 10 larger than expected for αvir = 1 (red line in Fig. 4), suggesting that the turbulent kinetic energy strongly exceeds the gravitational energy on all relevant scales. This includes for example the ~ 100 pc scale at which disks akin to that of 3C 326 N, but without additional turbulence from the jet, would fragment (Escala & Larson 2008, dot-dashed vertical line in Fig. 4), and the cloud sizes of few tens of parsec typically adopted in simulations of turbulent jet cocoons (Wagner & Bicknell 2011; Antonuccio-Delogu & Silk 2008).
Figure 4 also shows that turbulent velocities in 3C 326 N are likely much greater than those in typical molecular clouds in the Milky Way (Heyer et al. 2009, gray circles in Fig. 4). This may hold the key to explaining the low star-formation rates. Local density enhancements owing to turbulent compression may enable star formation in clouds with αvir ≳ 1, but the star formation efficiency decreases rapidly with increasing αvir (e.g., Krumholz & McKee 2005; Padoan & Nordlund 2011).
These arguments rely on the assumption that Larson’s scaling relationship approximately holds for 3C 326 N. Resolving scales of ~100 pc will only become possible once ALMA reaches its full capabilities, although we can already see in Fig. 4 that Larson’s scaling law (green hatched area) normalized to the measured range of velocities on kpc scales falls within the range of turbulence required to account for the observed H2 luminosity.
5. Concluding remarks
Our results suggest that AGN can create large reservoirs of dense, rapidly cooling molecular gas, as suggested by models of AGN-triggered star formation (e.g., Mellema et al. 2002; Fragile et al. 2004; Silk & Norman 2009), but this does not per se seem sufficient to form stars. The turbulent energy injected by the jet seems capable of retaining significant fractions of the gas warm (T > 150 K) and gravitationally unbound, making star formation very inefficient.
The galaxy 3C 326 N is certainly an extreme example of a gas-rich radio galaxy with a very low star-formation efficiency, although it is not unique. Thirty percent of nearby 3CR radio galaxies have bright line emission from warm H2 (Ogle et al. 2010), and emission-line diagnostics suggest that much of this gas could be heated mechanically through shocks (N10). This includes galaxies such as 3C 293, which have ongoing star formation, albeit not at the level expected from their H2 reservoirs (Papadopoulos et al. 2010). It will be interesting to investigate in more depth how star formation and molecular gas kinematics are related in these cases.
For R = 1.6 kpc. N10 found a smaller offset with a fiducial R = 2.5 kpc
Acknowledgments
We are very grateful to the staff at Paranal Observatory for carrying out the observations. Without the continuous, excellent work of the ESO staff and fellows, our analysis would not have been possible. We thank the referee for comments that helped improve the manuscript.
References
- Antonuccio-Delogu, V., & Silk, J. 2008, MNRAS, 389, 1750 [NASA ADS] [CrossRef] [Google Scholar]
- Bertoldi, F., & McKee, C. F. 1992, ApJ, 395, 140 [NASA ADS] [CrossRef] [Google Scholar]
- Bonnet, H., Abuter, R., Baker, A., et al. 2004, The Messenger, 117, 17 [NASA ADS] [Google Scholar]
- Brighenti, F., & Mathews, W. G. 2006, ApJ, 643, 120 [NASA ADS] [CrossRef] [Google Scholar]
- Ciotti, L., D’Ercole, A., Pellegrini, S., & Renzini, A. 1991, ApJ, 376, 380 [NASA ADS] [CrossRef] [Google Scholar]
- Dasyra, K. M., & Combes, F. 2011, A&A, 534, A138 [NASA ADS] [CrossRef] [EDP Sciences] [Google Scholar]
- de Koff, S., Best, P., Baum, S. A., et al. 2000, ApJS, 129, 33 [NASA ADS] [CrossRef] [Google Scholar]
- de Ruiter, H. R., et al. 2002, A&A, 396, 857 [NASA ADS] [CrossRef] [EDP Sciences] [Google Scholar]
- Escala, A., & Larson, R. B. 2008, ApJ, 685, L31 [NASA ADS] [CrossRef] [Google Scholar]
- Fragile, P. C., Murray, S. D., Anninos, P., & van Breugel, W. 2004, ApJ, 604, 74 [NASA ADS] [CrossRef] [Google Scholar]
- Glover, S. C. O., & Mac Low, M. 2007, ApJ, 659, 1317 [NASA ADS] [CrossRef] [Google Scholar]
- Guillard, P., Boulanger, F., Pineau Des Forêts, G., & Appleton, P. N. 2009, A&A, 502, 515 [NASA ADS] [CrossRef] [EDP Sciences] [Google Scholar]
- Guillard, et al. 2011, ApJ, submitted [Google Scholar]
- Heckman, T. M., Parma, P., Capetti, A., Fanti, R., & Morganti, R. 1981, ApJ, 247, 403 [NASA ADS] [CrossRef] [Google Scholar]
- Herrera, C. N., Boulanger, F., & Nesvadba, N. P. H. 2011, A&A, 534, A138 [NASA ADS] [CrossRef] [EDP Sciences] [Google Scholar]
- Heyer, M., Krawczyk, C., Duval, J., & Jackson, J. M. 2009, ApJ, 699, 1092 [NASA ADS] [CrossRef] [Google Scholar]
- Krajnović, D., Cappellari, M., de Zeeuw, P. T., & Copin, Y. 2006, MNRAS, 366, 787 [NASA ADS] [CrossRef] [Google Scholar]
- Krause, M., & Alexander, P. 2007, MNRAS, 376, 465 [NASA ADS] [CrossRef] [Google Scholar]
- Krumholz, M. R., & McKee, C. F. 2005, ApJ, 630, 250 [NASA ADS] [CrossRef] [Google Scholar]
- Larson, R. B. 1981, MNRAS, 194, 809 [NASA ADS] [CrossRef] [Google Scholar]
- Le Petit, F., Nehmé, C., Le Bourlot, J., & Roueff, E. 2006, ApJS, 164, 506 [NASA ADS] [CrossRef] [EDP Sciences] [Google Scholar]
- McKee, C. F., & Ostriker, E. C. 2007, ARA&A, 45, 565 [NASA ADS] [CrossRef] [Google Scholar]
- Mellema, G., Kurk, J. D., & Röttgering, H. J. A. 2002, A&A, 395, L13 [NASA ADS] [CrossRef] [EDP Sciences] [Google Scholar]
- Mouri, H., Taniguchi, Y., Kawara, K., & Nishida, M. 1989, ApJ, 346, L73 [NASA ADS] [CrossRef] [Google Scholar]
- Nesvadba, N. P. H., Lehnert, M. D., Davies, R. I., Verma, A., & Eisenhauer, F. 2008, A&A, 479, 67 [NASA ADS] [CrossRef] [EDP Sciences] [Google Scholar]
- Nesvadba, N. P. H., Boulanger, F., Salomé, P., et al. 2010, A&A, 521, A65 [NASA ADS] [CrossRef] [EDP Sciences] [Google Scholar]
- Nesvadba, N., De Breuck, C., Lehnert, M., et al. 2011a, A&A, 525, A43 [NASA ADS] [CrossRef] [EDP Sciences] [Google Scholar]
- Nesvadba, N. P. H., Polletta, M., Lehnert, M. D., et al. 2011b, MNRAS, 415, 2359 [NASA ADS] [CrossRef] [Google Scholar]
- Ogle, P., Antonucci, R., Appleton, P. N., & Whysong, D. 2007, ApJ, 668, 699 [NASA ADS] [CrossRef] [Google Scholar]
- Ogle, P., Boulanger, F., Guillard, P., et al. 2010, ApJ, 724, 1193 [NASA ADS] [CrossRef] [Google Scholar]
- Oosterloo, T. A., Morganti, R., Sadler, E. M., van der Hulst, T., & Serra, P. 2007, A&A, 465, 787 [NASA ADS] [CrossRef] [EDP Sciences] [Google Scholar]
- Ostriker, E. C., Stone, J. M., & Gammie, C. F. 2001, ApJ, 546, 980 [NASA ADS] [CrossRef] [Google Scholar]
- Padoan, P., & Nordlund, Å. 2011, ApJ, 730, 40 [NASA ADS] [CrossRef] [Google Scholar]
- Papadopoulos, P. P., van der Werf, P., Isaak, K., & Xilouris, E. M. 2010, ApJ, 715, 775 [NASA ADS] [CrossRef] [Google Scholar]
- Pizzolato, F., & Soker, N. 2005, ApJ, 632, 821 [NASA ADS] [CrossRef] [Google Scholar]
- Pizzolato, F., & Soker, N. 2010, MNRAS, 408, 961 [NASA ADS] [CrossRef] [Google Scholar]
- Puxley, P. J., Hawarden, T. G., & Mountain, C. M. 1990, ApJ, 364, 77 [NASA ADS] [CrossRef] [Google Scholar]
- Schoenmakers, A. P., de Bruyn, A. G., Röttgering, H. J. A., van der Laan, H., & Kaiser, C. R. 2000, MNRAS, 315, 371 [NASA ADS] [CrossRef] [Google Scholar]
- Silk, J., & Norman, C. 2009, ApJ, 700, 262 [NASA ADS] [CrossRef] [Google Scholar]
- Sutherland, R. S., & Bicknell, G. V. 2007, ApJS, 173, 37 [NASA ADS] [CrossRef] [Google Scholar]
- Verdoes Kleijn, G. A., van der Marel, R. P., & Noel-Storr, J. 2006, AJ, 131, 1961 [NASA ADS] [CrossRef] [Google Scholar]
- Wagner, A. Y., & Bicknell, G. V. 2011, ApJ, 728, 29 [NASA ADS] [CrossRef] [Google Scholar]
- Willis, A. G., & Strom, R. G. 1978, A&A, 62, 375 [NASA ADS] [Google Scholar]
All Tables
Line properties derived from the “stacked” spectrum, i.e., the integrated spectrum with the large-scale velocity gradient removed.
All Figures
|
Fig. 1 Integrated K-band spectrum of 3C 326 N. The properties of labeled lines are listed in Table 1. |
| In the text | |
|
Fig. 2 Emission-line profile of H2 1–0 S(3) extracted from a 0.6′′ × 0.6′′ aperture on the northern disk (black line) fit with 3 Gaussian components (light blue line). The fit residual is shown below. |
| In the text | |
|
Fig. 3 (top, left to right) Maps of the line fluxes, relative velocities, and FWHMs of H2 1–0 S(3) in km s-1. (bottom, left to right) Line asymmetry of the 20-percentile for S(1), S(3), and Paα, respectively, in km s-1. Contours mark the continuum peak. |
| In the text | |
|
Fig. 4 Turbulent velocity as a function of size. Black symbols show our data for CO, H21–0 lines, and Paα, respectively. The red dotted line is for αvir = 1 for a constant mass-surface density Σgas = 250 M⊙ pc-2 and the green hatched region shows the range implied by Larson’s scaling law and the range of velocities measured on kpc scales. Black circles show the molecular clouds of Heyer et al. (2009). These points fall near the αvir = 1 relation for gas surface densities ~5 smaller than that of 3C 326 N. The horizontal dot-dashed line shows the maximal clump size of ~100 pc. See Sect. 4 for details. |
| In the text | |
Current usage metrics show cumulative count of Article Views (full-text article views including HTML views, PDF and ePub downloads, according to the available data) and Abstracts Views on Vision4Press platform.
Data correspond to usage on the plateform after 2015. The current usage metrics is available 48-96 hours after online publication and is updated daily on week days.
Initial download of the metrics may take a while.