Free Access
Fig. 7
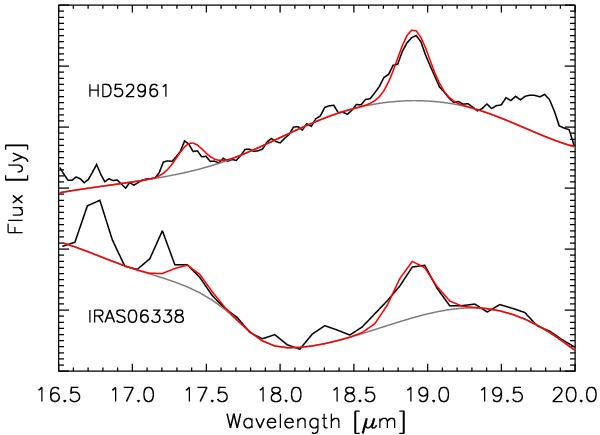
The observed spectra of HD 52961 and IRAS 06338 (black) with the estimated spline continuum (grey). In red we overplot the Gaussian profiles that were fit to the two C60 bands. The spectra are scaled and offset for comparison.
Current usage metrics show cumulative count of Article Views (full-text article views including HTML views, PDF and ePub downloads, according to the available data) and Abstracts Views on Vision4Press platform.
Data correspond to usage on the plateform after 2015. The current usage metrics is available 48-96 hours after online publication and is updated daily on week days.
Initial download of the metrics may take a while.