Fig. 6
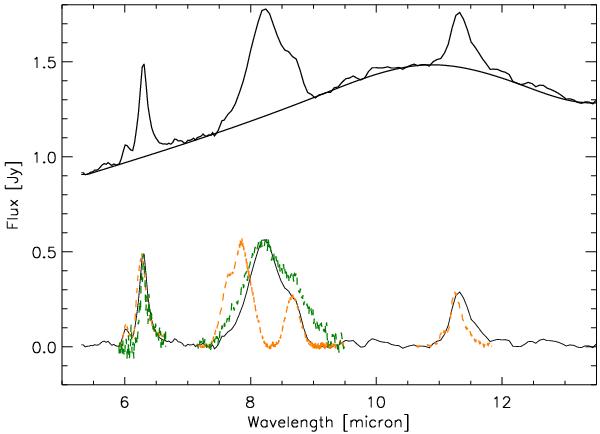
Identification of the PAH features in IRAS 13258. On the top we plot the spectrum shortwards of 13 μm, together with a spline fit to represent the underlying continuum. The residual spectrum is given below, together with an example of the class B (orange) and class C (dark green) PAH features as described by Peeters et al. (2002) and van Diedenhoven et al. (2004).
Current usage metrics show cumulative count of Article Views (full-text article views including HTML views, PDF and ePub downloads, according to the available data) and Abstracts Views on Vision4Press platform.
Data correspond to usage on the plateform after 2015. The current usage metrics is available 48-96 hours after online publication and is updated daily on week days.
Initial download of the metrics may take a while.