Fig. 5
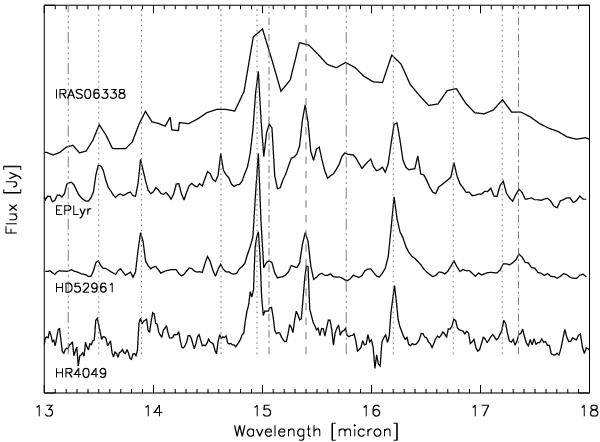
The CO2 emission region of IRAS 06338, compared to other post-AGB sources showing CO2 gas emission (Cami & Yamamura 2001; Gielen et al. 2009). Dotted lines show the location of 12C16O2 features, dashed lines give 13C16O2 and dot-dashed lines show 16O12C18O. Dot-dot-dashed lines mark unidentified features. The spectra are scaled and offset for comparison. For HD 52961, the underlying feature at 16 μm was removed.
Current usage metrics show cumulative count of Article Views (full-text article views including HTML views, PDF and ePub downloads, according to the available data) and Abstracts Views on Vision4Press platform.
Data correspond to usage on the plateform after 2015. The current usage metrics is available 48-96 hours after online publication and is updated daily on week days.
Initial download of the metrics may take a while.