Fig. 1
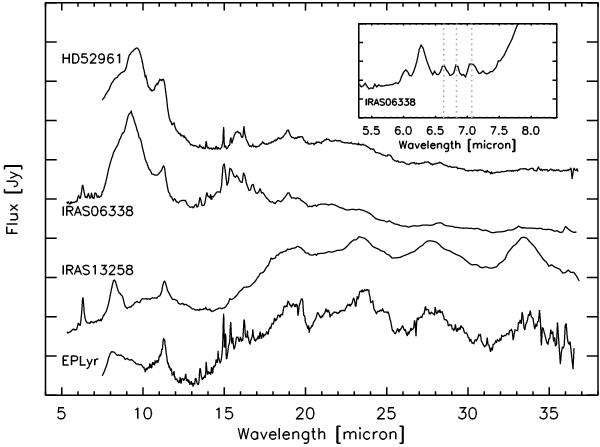
The Spitzer-IRS high- and low-resolution spectra of our three sample stars IRAS 13258, IRAS 06338 and HD 52961, together with the spectrum of EP Lyr, which shows similar emission features. The spectra are scaled and offset for comparison. The inset plot shows the 7 μm region of IRAS 06338 and IRAS 13258. The dotted gray lines mark the observed features at 6.63, 6.83 and 7.07 μm, probably due to small PAH, aliphatic hydrocarbons, and/or hydrogenated amorphous carbon emission.
Current usage metrics show cumulative count of Article Views (full-text article views including HTML views, PDF and ePub downloads, according to the available data) and Abstracts Views on Vision4Press platform.
Data correspond to usage on the plateform after 2015. The current usage metrics is available 48-96 hours after online publication and is updated daily on week days.
Initial download of the metrics may take a while.