Fig. 7
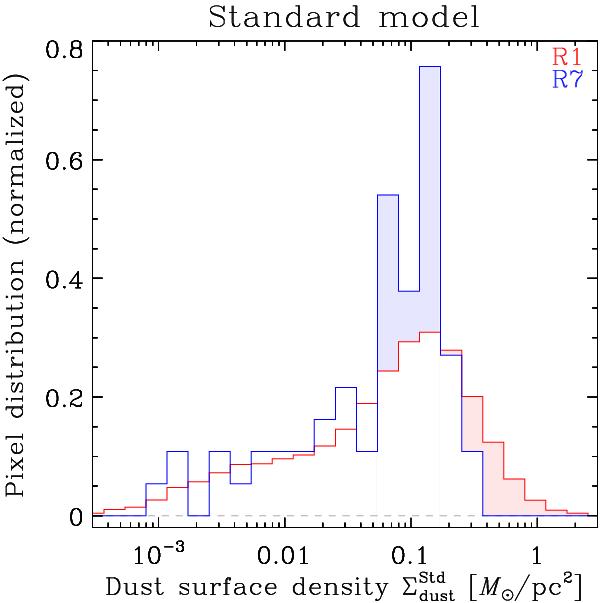
Pixel distribution of the dust mass surface density for two spatial resolutions. We plot only the “standard model”. The figure is qualitatively similar for the “AC model”. The distributions are normalized. It shows that, at lower spatial resolution, the very high surface densities are missed (red filled area), and there is an excess of intermediate surface densities (blue filled area).
Current usage metrics show cumulative count of Article Views (full-text article views including HTML views, PDF and ePub downloads, according to the available data) and Abstracts Views on Vision4Press platform.
Data correspond to usage on the plateform after 2015. The current usage metrics is available 48-96 hours after online publication and is updated daily on week days.
Initial download of the metrics may take a while.