Fig. 5
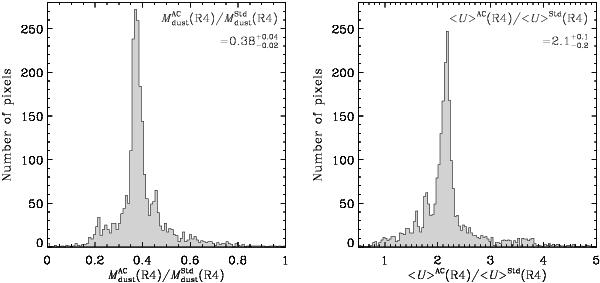
Comparison between the parameters obtained with the two models. The left panel shows the statistical distribution of the pixel-to-pixel dust mass ratio between the “AC model” and the “standard model” at spatial resolution R4. The right panel shows a similar ratio for the mass averaged starlight intensity ⟨ U ⟩ .
Current usage metrics show cumulative count of Article Views (full-text article views including HTML views, PDF and ePub downloads, according to the available data) and Abstracts Views on Vision4Press platform.
Data correspond to usage on the plateform after 2015. The current usage metrics is available 48-96 hours after online publication and is updated daily on week days.
Initial download of the metrics may take a while.