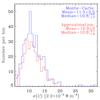
Fig. 4
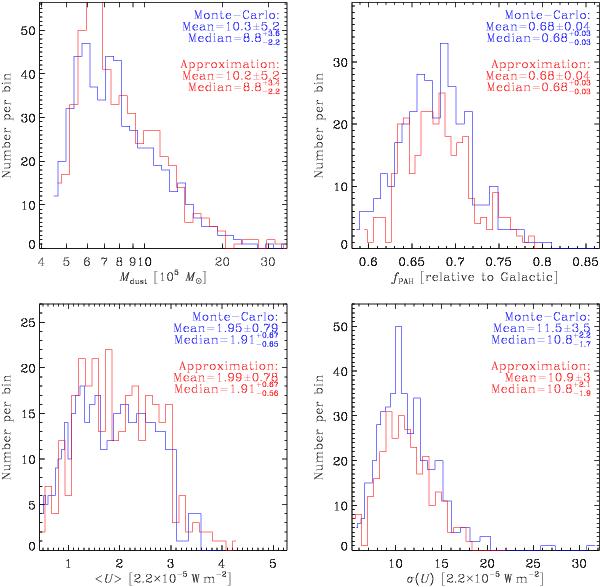
Distribution of the main parameters of the perturbed SED fits of the four R9 pixels (Fig. 3). For each parameter, we show the number of Monte-Carlo fits to the perturbed SED per bin of parameter value. The value of each parameter, for a given iteration is the combination of the values of the parameter for each of the 4 pixels. We quote both the mean and the median. The blue distributions correspond to the rigorous Monte-Carlo statistics, while the red distributions are from our reconstruction method (Appendix B).
Current usage metrics show cumulative count of Article Views (full-text article views including HTML views, PDF and ePub downloads, according to the available data) and Abstracts Views on Vision4Press platform.
Data correspond to usage on the plateform after 2015. The current usage metrics is available 48-96 hours after online publication and is updated daily on week days.
Initial download of the metrics may take a while.