Fig. 3
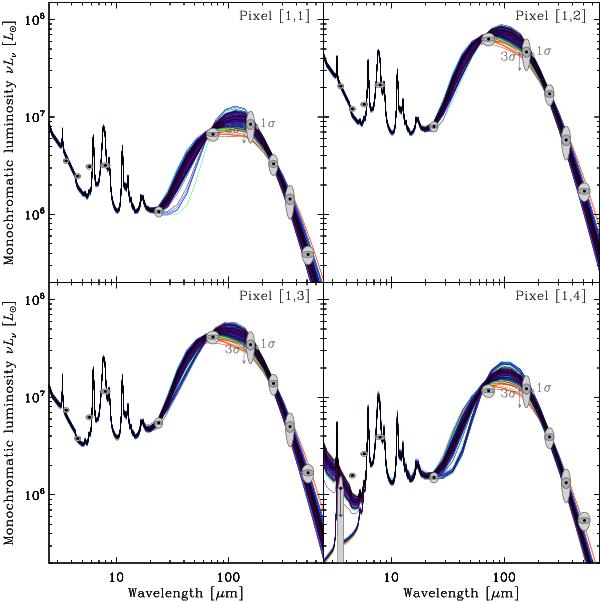
Demonstration of the Monte-Carlo method on the 4 pixels of the R9 map. The grey ellipses represent the unperturbed observations and their uncertainties: the filter band widths on the x direction; the ± 1σ error bars on the y direction (dark grey); and the ± 3σ error on the y direction (concentric light grey ellipse). The color lines show the NMC = 300 model fits to the perturbed fluxes. We used the “standard model” for the demonstration. Some points (like MIPS70 μm) appears shifted from the models because of the color correction. The two shortest wavelengths of the [1,4] pixel are poorly fitted since the IRAC3.6 μm is only an upper limit. This might be the result of oversubtraction of point sources in this low surface brightness region. However, this discrepancy affects only the level of the independent stellar contribution. It does not affect the longer wavelength fit.
Current usage metrics show cumulative count of Article Views (full-text article views including HTML views, PDF and ePub downloads, according to the available data) and Abstracts Views on Vision4Press platform.
Data correspond to usage on the plateform after 2015. The current usage metrics is available 48-96 hours after online publication and is updated daily on week days.
Initial download of the metrics may take a while.