Fig. C.1
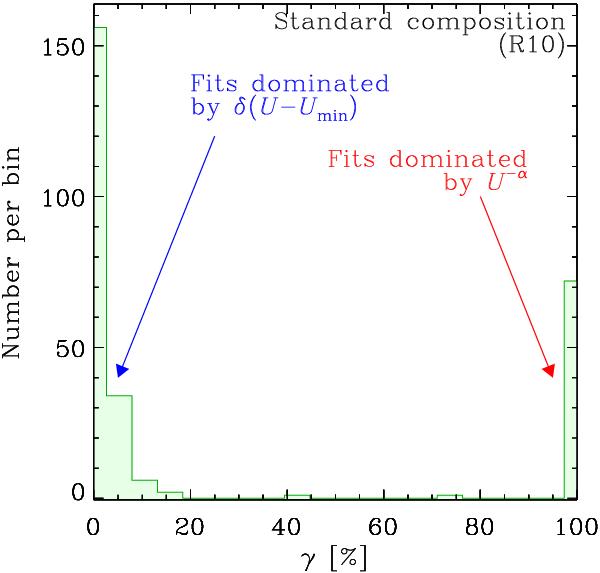
Test of the stability of the starlight intensity distribution of Eq. (C.1). The parameter γ is the mass fraction of the component in U−α. The histogram is the distribution of the Monte-Carlo iterations of the fit of Eq. (C.1) to the integrated strip (R10), with the grain composition of the “standard model”. The bimodality of the distribution is the sign of the instability of this formalism.
Current usage metrics show cumulative count of Article Views (full-text article views including HTML views, PDF and ePub downloads, according to the available data) and Abstracts Views on Vision4Press platform.
Data correspond to usage on the plateform after 2015. The current usage metrics is available 48-96 hours after online publication and is updated daily on week days.
Initial download of the metrics may take a while.