Fig. 19
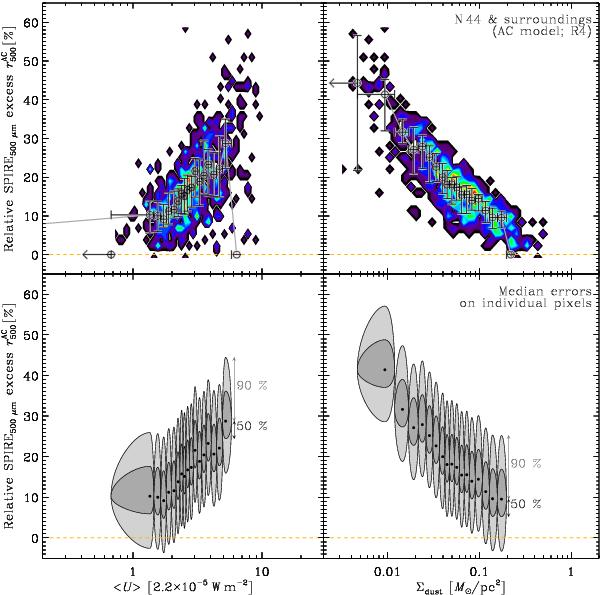
Pixel-to-pixel variations of r500 around N 44, for the “AC model”. This relation includes only the pixels of the window centered around N 44 and displayed in Fig. 18. The spatial resolution is R4. The two top panels show the pixel density number correlations (colors; scale indentical to Fig. 13). The error bars represent the stacked trends in different bins. The central positions and the error bars are the median of the pixel distribution. They account for the scattering of the relation, but not for the error on individual pixels. On the contrary, the two bottom panels show the same trends, but the ellipses are the median error bars on individual pixels (dark: 50%; light: 90%). The excess is significant when looking at resolved scales. The yellow dashed line shows the zero value (no excess).
Current usage metrics show cumulative count of Article Views (full-text article views including HTML views, PDF and ePub downloads, according to the available data) and Abstracts Views on Vision4Press platform.
Data correspond to usage on the plateform after 2015. The current usage metrics is available 48-96 hours after online publication and is updated daily on week days.
Initial download of the metrics may take a while.