Fig. 18
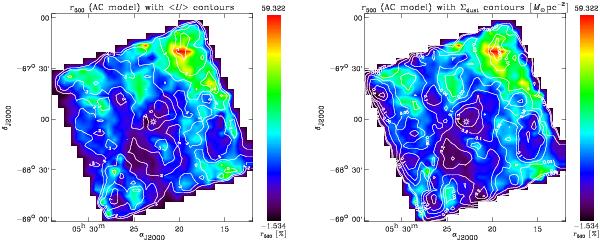
Zoom on N 44 and its surroundings. The color image is
 at R4,
with the “AC model”, for both panels. The contours are
⟨ U ⟩ AC(R4) for the left panel,
and
at R4,
with the “AC model”, for both panels. The contours are
⟨ U ⟩ AC(R4) for the left panel,
and  for the right panel. The white central star shows the location of the IR peak
emission. The distributions are very similar, with the two models.
for the right panel. The white central star shows the location of the IR peak
emission. The distributions are very similar, with the two models.
Current usage metrics show cumulative count of Article Views (full-text article views including HTML views, PDF and ePub downloads, according to the available data) and Abstracts Views on Vision4Press platform.
Data correspond to usage on the plateform after 2015. The current usage metrics is available 48-96 hours after online publication and is updated daily on week days.
Initial download of the metrics may take a while.