Fig. 17
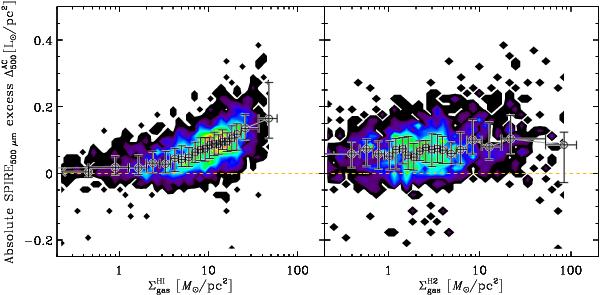
Pixel-to-pixel SPIRE500 μm absolute excess as a function of the column density of the atomic, and detected molecular phase. The spatial resolution is R4, the dust model is “AC”. The color scale is identical to Fig. 13. The error bars correspond to the binned trends. ΣH2 is the column density of molecular gas derived from the CO line observations, but does not account for the dark component detected in Sect. 4.3. The yellow dashed line shows the zero value (no excess).
Current usage metrics show cumulative count of Article Views (full-text article views including HTML views, PDF and ePub downloads, according to the available data) and Abstracts Views on Vision4Press platform.
Data correspond to usage on the plateform after 2015. The current usage metrics is available 48-96 hours after online publication and is updated daily on week days.
Initial download of the metrics may take a while.