Free Access
Fig. 16
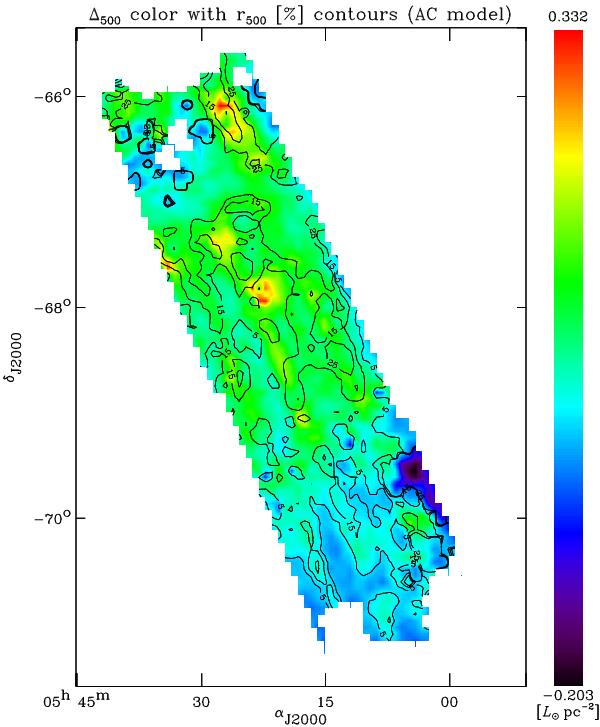
Spatial distributions of the SPIRE500 μm excesses. The spatial resolution is R4 (54 pc). The color image is the absolute excess Δ500, and the contours are the relative excess r500 (the contours are labeled in percent).
Current usage metrics show cumulative count of Article Views (full-text article views including HTML views, PDF and ePub downloads, according to the available data) and Abstracts Views on Vision4Press platform.
Data correspond to usage on the plateform after 2015. The current usage metrics is available 48-96 hours after online publication and is updated daily on week days.
Initial download of the metrics may take a while.