Fig. 15
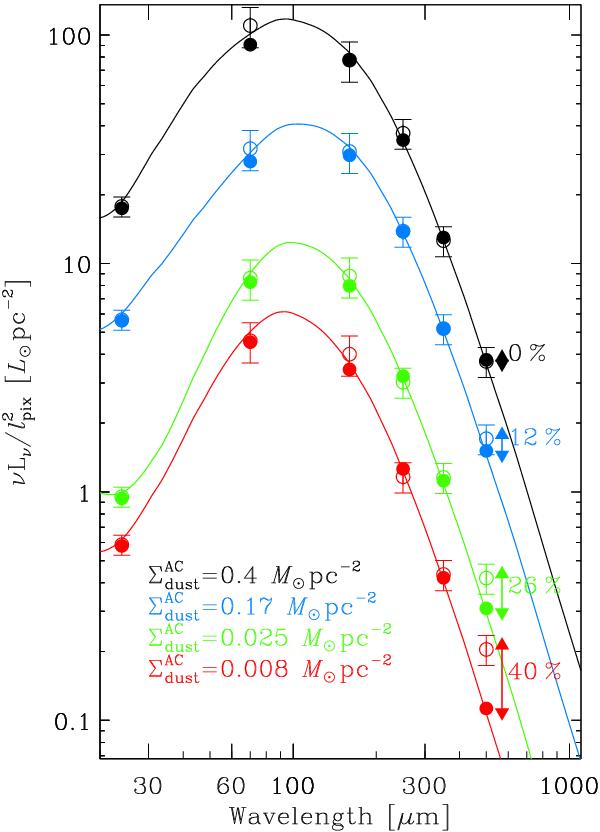
Different SEDs spanning the SPIRE500 μm excess range. These SEDs correspond to four pixels (at resolution R4; 54 pc), arbitrarily chosen. For each pixel the observations (open circle and error bar), the model (AC; solid line), and the model integrated in the broadband filters (filled circle) are displayed. For each SED, the corresponding dust mass surface density and the value of r500 are given.
Current usage metrics show cumulative count of Article Views (full-text article views including HTML views, PDF and ePub downloads, according to the available data) and Abstracts Views on Vision4Press platform.
Data correspond to usage on the plateform after 2015. The current usage metrics is available 48-96 hours after online publication and is updated daily on week days.
Initial download of the metrics may take a while.