Fig. 12
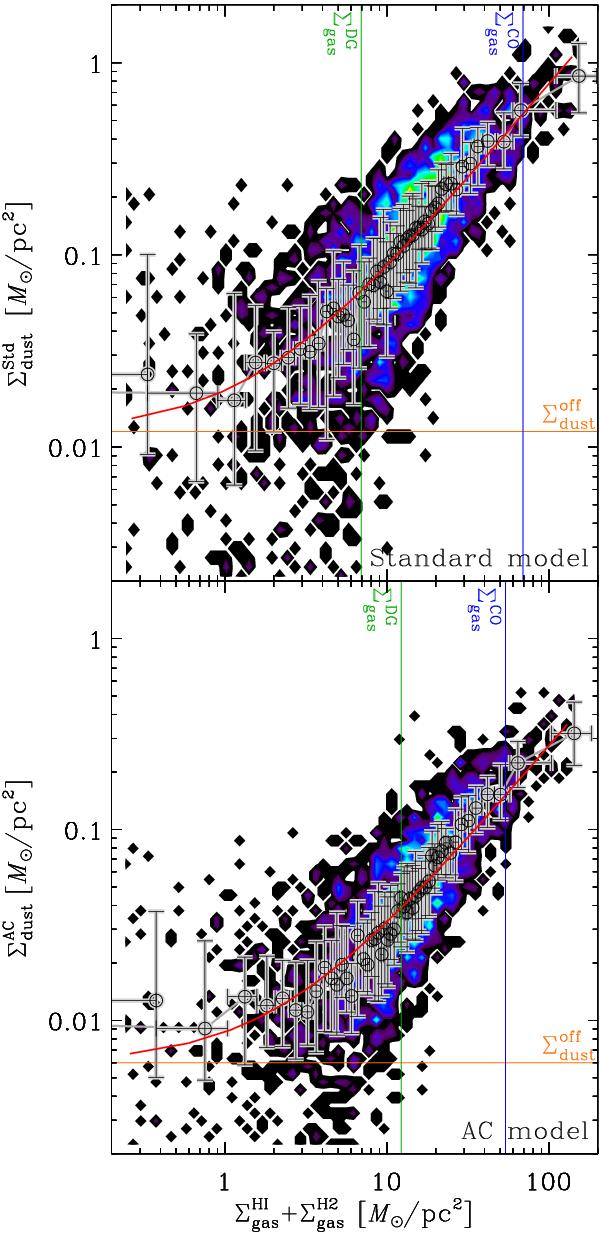
Correlation between the gas and dust mass column densities. Each panel
corresponds to a model. The spatial resolution is R4 (54 pc). The colored area is
the pixel density. The number density of pixels for each
[Σgas,Σdust] values is coded with the
same color scale as in Fig. 13. The circles
with error bars show the binned trend. The horizontal error bar displays the
Σgas bin width. The vertical error bar displays the dispersion in
Σdust within each Σgas bin. The Σgas bin sizes
are chosen so that each bin contains the same number of pixels. The red line is
the best fit of Eq. (24) to the
binned trend. The vertical lines show the best fit values
 and
and
 . The
horizontal line shows the best fit value of of
. The
horizontal line shows the best fit value of of
 .
.
Current usage metrics show cumulative count of Article Views (full-text article views including HTML views, PDF and ePub downloads, according to the available data) and Abstracts Views on Vision4Press platform.
Data correspond to usage on the plateform after 2015. The current usage metrics is available 48-96 hours after online publication and is updated daily on week days.
Initial download of the metrics may take a while.