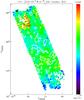
Fig. 10
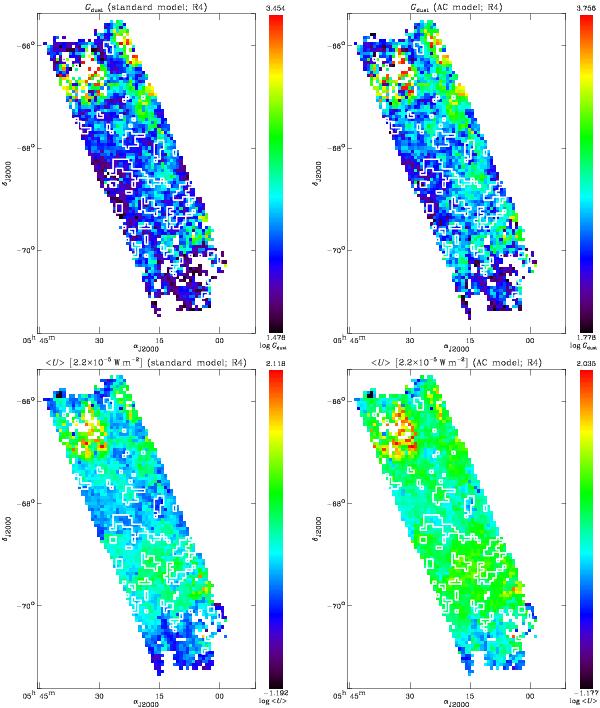
Spatial distribution of the main dust parameters, for the two models, at resolution R4 (54 pc). The color images of the two upper panels represent the gas-to-dust mass ratio map, for each model. The color images of the two lower panels represent the mass averaged starlight intensity map, for each model. The color scale is logarithmic. The white contours show the main CO concentrations from the Nanten map (Fukui et al. 2008). This contour level is chosen so that 90% of the CO mass has a higher column density than this level. In other words, 90% of the CO mass is in these concentrations.
Current usage metrics show cumulative count of Article Views (full-text article views including HTML views, PDF and ePub downloads, according to the available data) and Abstracts Views on Vision4Press platform.
Data correspond to usage on the plateform after 2015. The current usage metrics is available 48-96 hours after online publication and is updated daily on week days.
Initial download of the metrics may take a while.