Fig. A.1
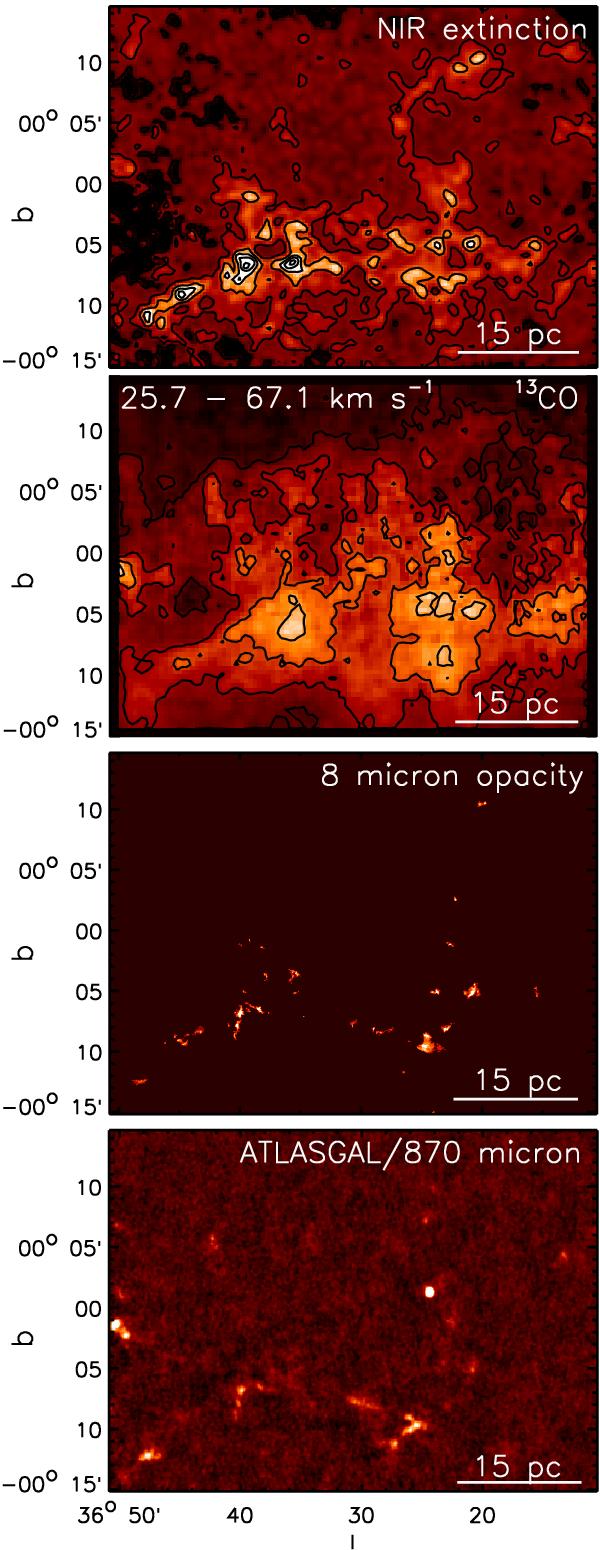
IRDC complex 36.74-00.16. The panels show the NIR dust extinction, 13CO line emission, 8 μm dust opacity, and 870 μm dust emission maps of the complex. The contours of the AV map start from 3 mag and the step is 4 mag. The contours of the CO map are in multiples of 15 K km s-1. The velocity range chosen for 13CO data is shown in the CO map. The 8 μm color scale saturates white at AV ≈ 20 mag and the color scale of the 870 μm map at AV ≈ 7 mag. The panels show a scale bar corresponding to the distance derived using foreground source count method (Dfg in Table 1).
Current usage metrics show cumulative count of Article Views (full-text article views including HTML views, PDF and ePub downloads, according to the available data) and Abstracts Views on Vision4Press platform.
Data correspond to usage on the plateform after 2015. The current usage metrics is available 48-96 hours after online publication and is updated daily on week days.
Initial download of the metrics may take a while.