Fig. 5
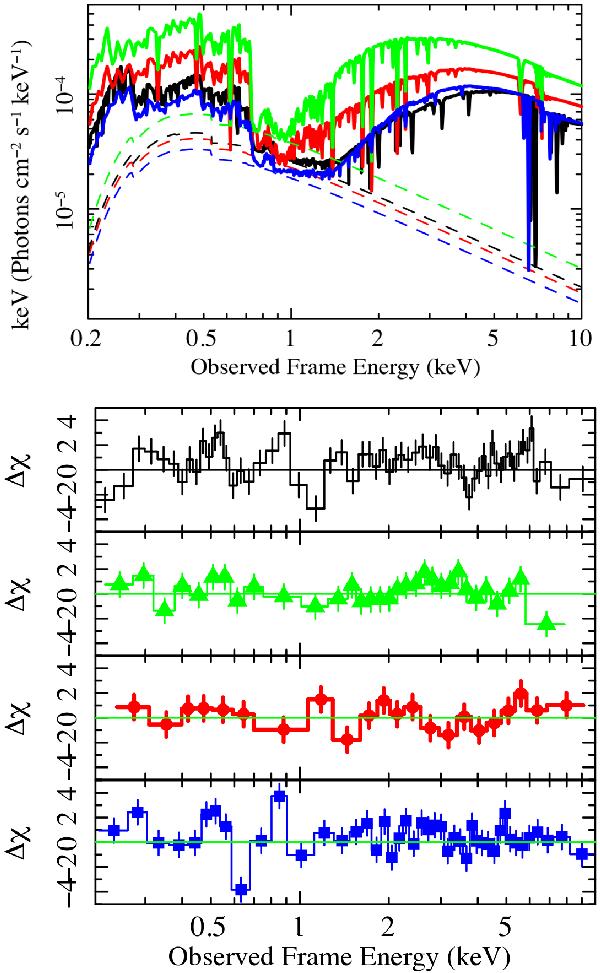
Top panel: the solid lines show the power-law emission after the passage through two absorbers, one of which is partially covering the source (model B). This model was fit to the average 2009 Long Look (black), Dec. 2008 (green), Jun. 2008 (red), and Dec. 2004 (blue) epoch spectra. The dashed lines represent the direct continuum components that are not absorbed. Bottom panel: average 2009 Long Look (black points), Dec. 2008 (green triangles), Jun. 2008 (red circles), and Dec. 2004 (blue squares) spectral residuals relative to model B; the data have been rebinned for visual purpose only to respectively 15, 5, 5, and 10σ.
Current usage metrics show cumulative count of Article Views (full-text article views including HTML views, PDF and ePub downloads, according to the available data) and Abstracts Views on Vision4Press platform.
Data correspond to usage on the plateform after 2015. The current usage metrics is available 48-96 hours after online publication and is updated daily on week days.
Initial download of the metrics may take a while.