Fig. 1
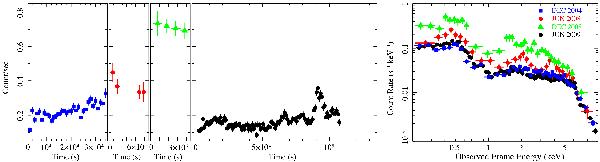
Variability of PG 1126-041 on month time scales. Left panel: background subtracted 0.2 − 10 keV pn light curves extracted in the four different epochs of XMM-Newton observations and binned to 1 ks: December 2004 (blue squares), June 2008 (red circles), December 2008 (green triangles), and 2009 Long Look (black circles). Right panel: the time-averaged pn spectra corresponding to the time intervals shown on the left and using the same color codes.
Current usage metrics show cumulative count of Article Views (full-text article views including HTML views, PDF and ePub downloads, according to the available data) and Abstracts Views on Vision4Press platform.
Data correspond to usage on the plateform after 2015. The current usage metrics is available 48-96 hours after online publication and is updated daily on week days.
Initial download of the metrics may take a while.