Fig. 9
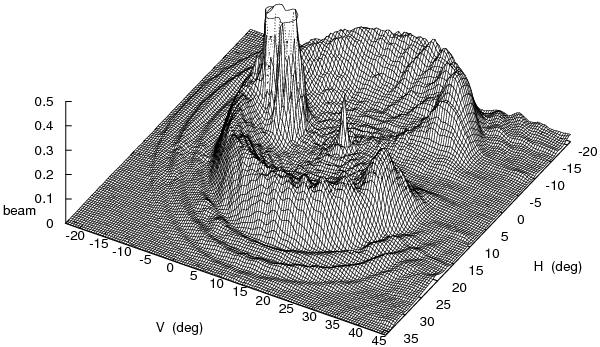
GBT response pattern P, as measured from scans of the Sun, on a linear scale. The H and V coordinates are the same as in Figs. 6 and 8. Note that this plot has been rotated so that its features are more easily visible – the vertical coordinate V increases from left to right in this figure. The truncated peak at center-left in this figure comprises both the main beam at (H,V) = (0,0) and the double-peak feature at (H,V) ~ (± 1°, −3°); the peak of the main beam would be far offscale at P = 1.12 × 10⁵. Near the center of the spillover lobe, the Arago spot is visible. The gap at high V in the spillover lobe and its surrounding rings arises from the presence of the reflecting screen at the subreflector edge.
Current usage metrics show cumulative count of Article Views (full-text article views including HTML views, PDF and ePub downloads, according to the available data) and Abstracts Views on Vision4Press platform.
Data correspond to usage on the plateform after 2015. The current usage metrics is available 48-96 hours after online publication and is updated daily on week days.
Initial download of the metrics may take a while.