Fig. 8
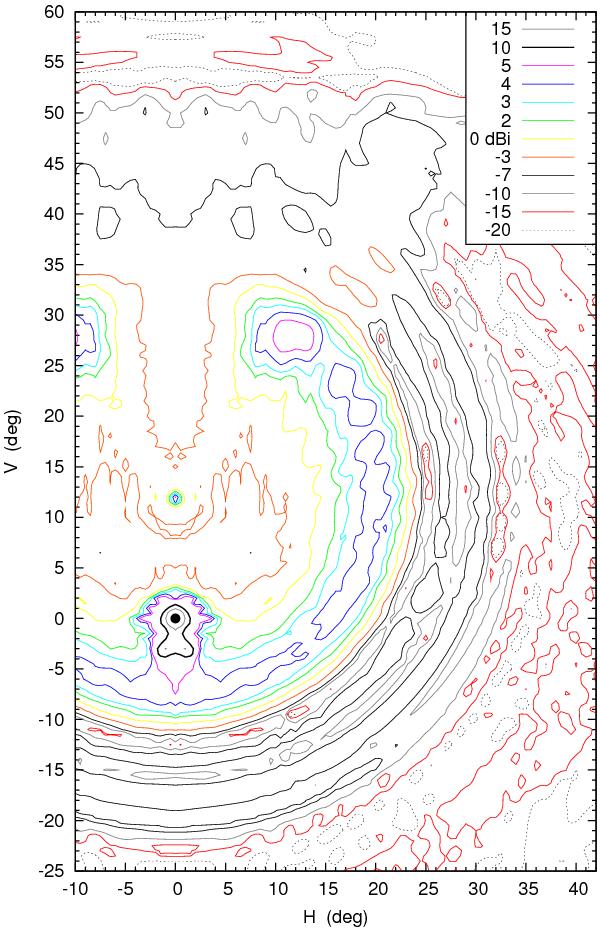
Contours of the measured GBT far sidelobe gain G, relative to isotropic. The main beam is at the origin (indicated by the solid dot), and would peak at + 61.6 dBi. The H and V coordinates are the same as in Fig. 6. Elevation increases upward in the plot and the direction to the center of the subreflector is at V = 12.3°. The main “spillover lobe” is outlined by the yellow 0 dBi contour, with the blue 4 dBi and magenta 5 dBi contours defining its ridge; curving as a ring from below the main beam at (H,V) ~ (0°, −7°), it extends to about (H,V) ~ (12°,28°), beyond which it is blocked by the screen on the telescope arm (note that this blockage also yields a ridge stretching upward from the subreflector center along the edge of the gap at an angle about 35° from the vertical; this ridge passes through the end of the spillover lobe). Complementary to this missing part of the spillover lobe caused by the screen are the twin peaks below the main beam, at (H,V) ~ (± 1°, −3°), visible in the heavy black 10 dBi and thin gray 15 dBi contours. Outside the spillover lobe are three lower-amplitude rings (at radii θ ~ 26°, 29.5°, and 33° from the subreflector center). Inside is the Arago spot and surrounding rings centred at 11.879° on the axis above the main beam. Some features are easier to see in the 3Dplots of Figs. 9 and 10. Outside the faint spillover rings and outside the region (| H| < 35°,20° < V < 53°), the sidelobe levels are taken from the antenna code calculations.
Current usage metrics show cumulative count of Article Views (full-text article views including HTML views, PDF and ePub downloads, according to the available data) and Abstracts Views on Vision4Press platform.
Data correspond to usage on the plateform after 2015. The current usage metrics is available 48-96 hours after online publication and is updated daily on week days.
Initial download of the metrics may take a while.