Fig. 6
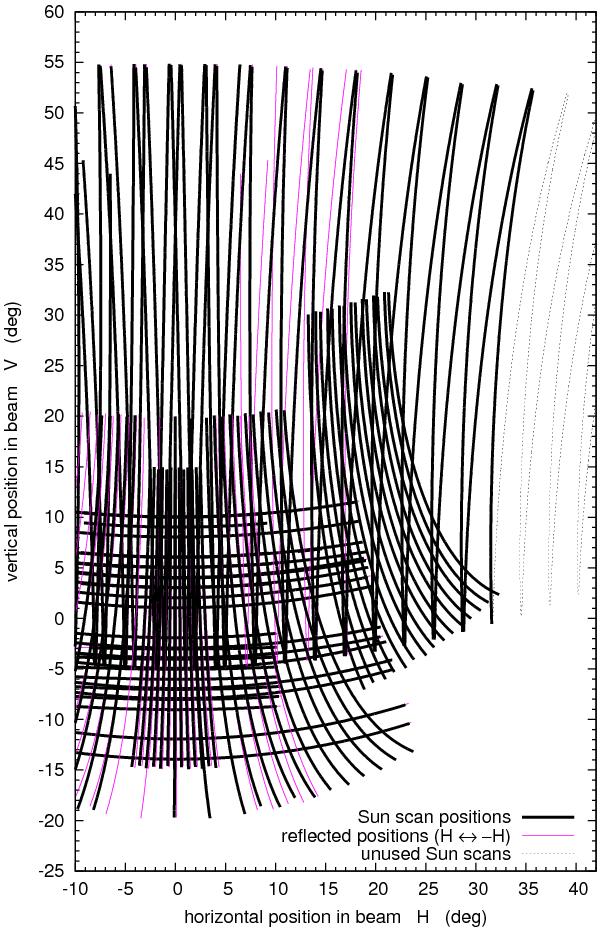
Mapping the GBT sidelobe pattern using the Sun. Heavy lines indicate the position of the Sun relative to the main beam during the scan. Thin magenta lines indicate scans reflected in the beam’s line of symmetry (i.e., with the H coordinate replaced by −H). Dotted lines at high H show measurements that were not used because they showed no visible sidelobes above the noise. The center of the subreflector is 12.3° above the main beam.
Current usage metrics show cumulative count of Article Views (full-text article views including HTML views, PDF and ePub downloads, according to the available data) and Abstracts Views on Vision4Press platform.
Data correspond to usage on the plateform after 2015. The current usage metrics is available 48-96 hours after online publication and is updated daily on week days.
Initial download of the metrics may take a while.